How to Read Results in svEye: Dashboards, Timelines, and Smart Summaries
What this tutorial is about
- The Results page is where data turns into insight.
- It combines dashboards, timelines, and articles into one analytical view.
- This tutorial explains how to read results and decide what to explore next.
When to use the Results page
Use the Results page when you want to:
- understand what is happening and why
- spot trends, spikes, and anomalies
- move from detection to interpretation
Typical users:
- risk & intelligence analysts
- supply chain and procurement teams
- decision-makers needing fast context
Video walkthrough⬈
What you’ll see in the video:
- how dashboards are structured
- how to switch between result views
- how to drill down into articles
Step-by-step: Understanding the Results page
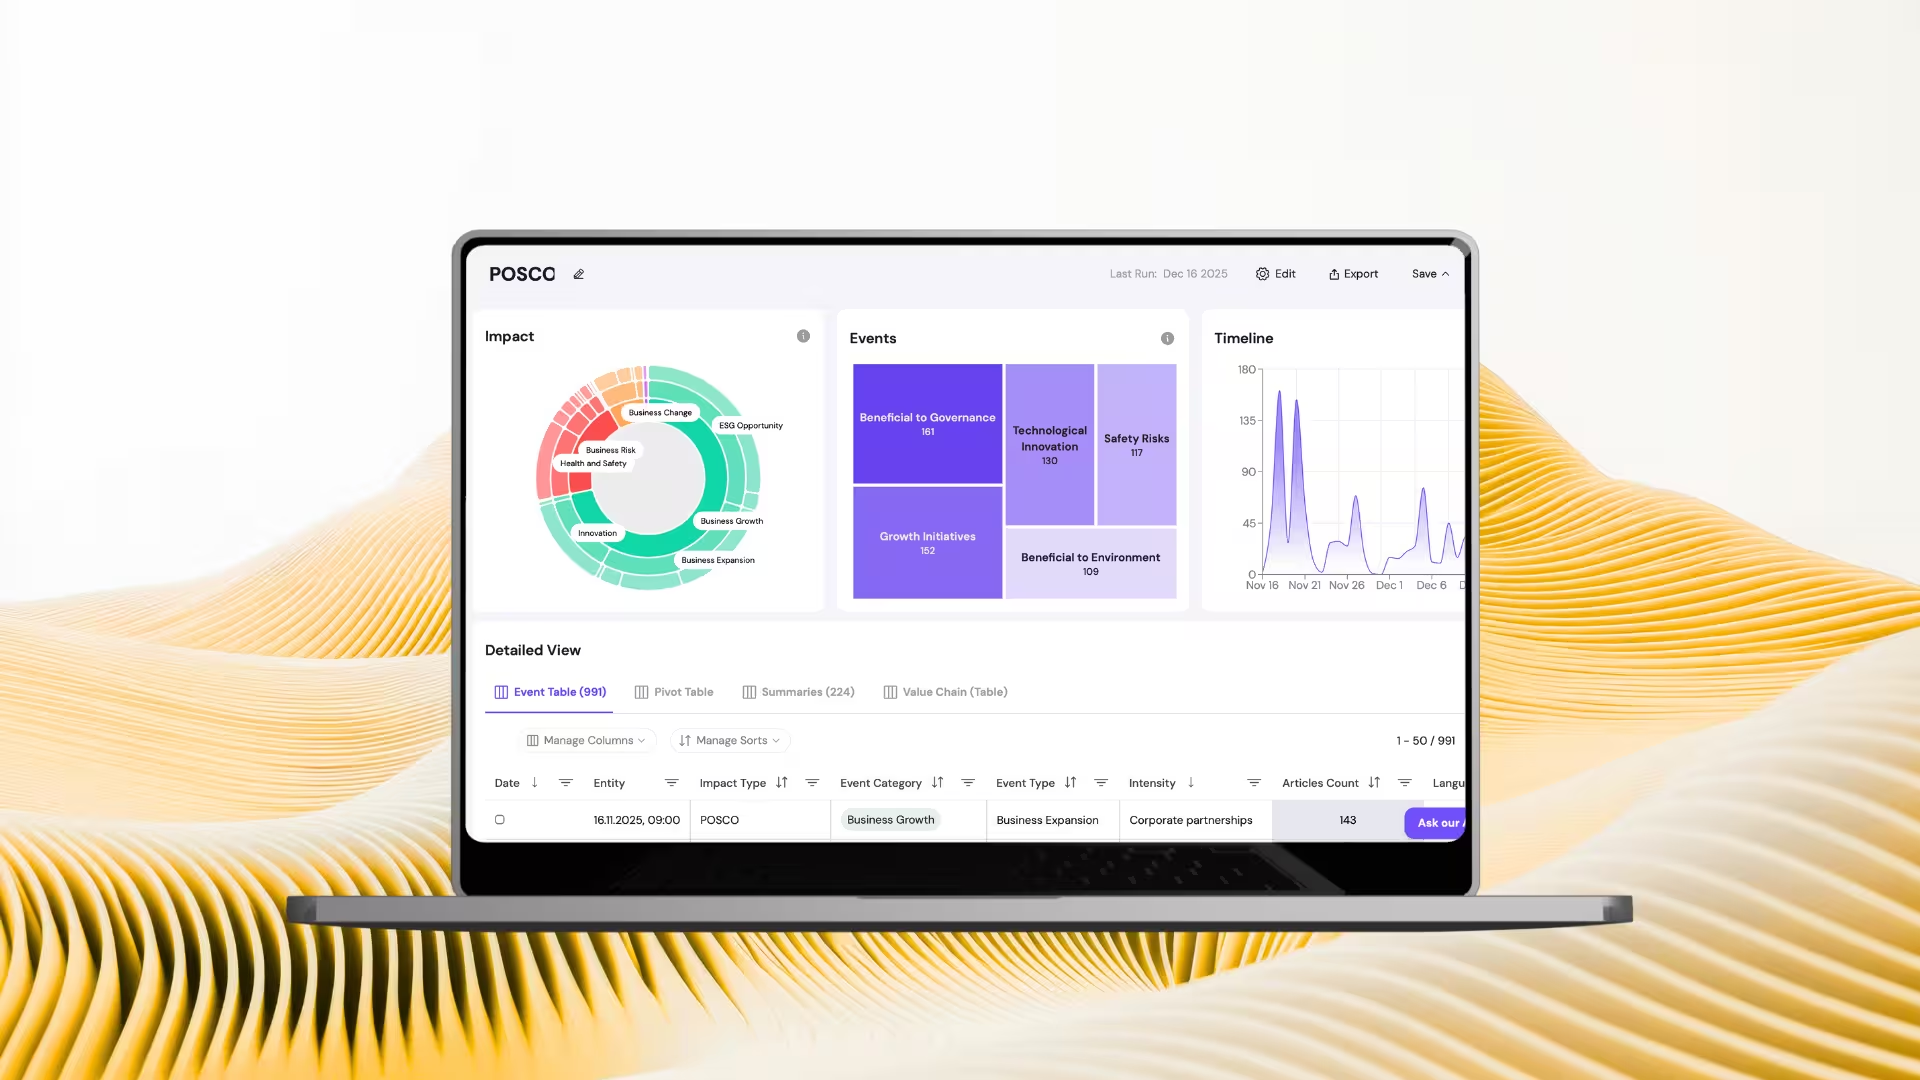
Step 1: Start with the dashboard
- The results dashboard gives you an instant overview.
- It includes:
- Sunburst chart showing event distribution
- Top entities or events
- An interactive timeline
Step 2: Interact with the charts
- All charts are clickable.
- Selecting any segment instantly updates the context and results.
Step 3: Switch between result views
- You can view results as:
- Events
- Pivot tables
- Smart Summaries
- Each view answers a different question.
Step 4: Drill down in Pivot tables
- Pivot tables let you break results down by dimension.
- Click any cell to zoom into the underlying data.
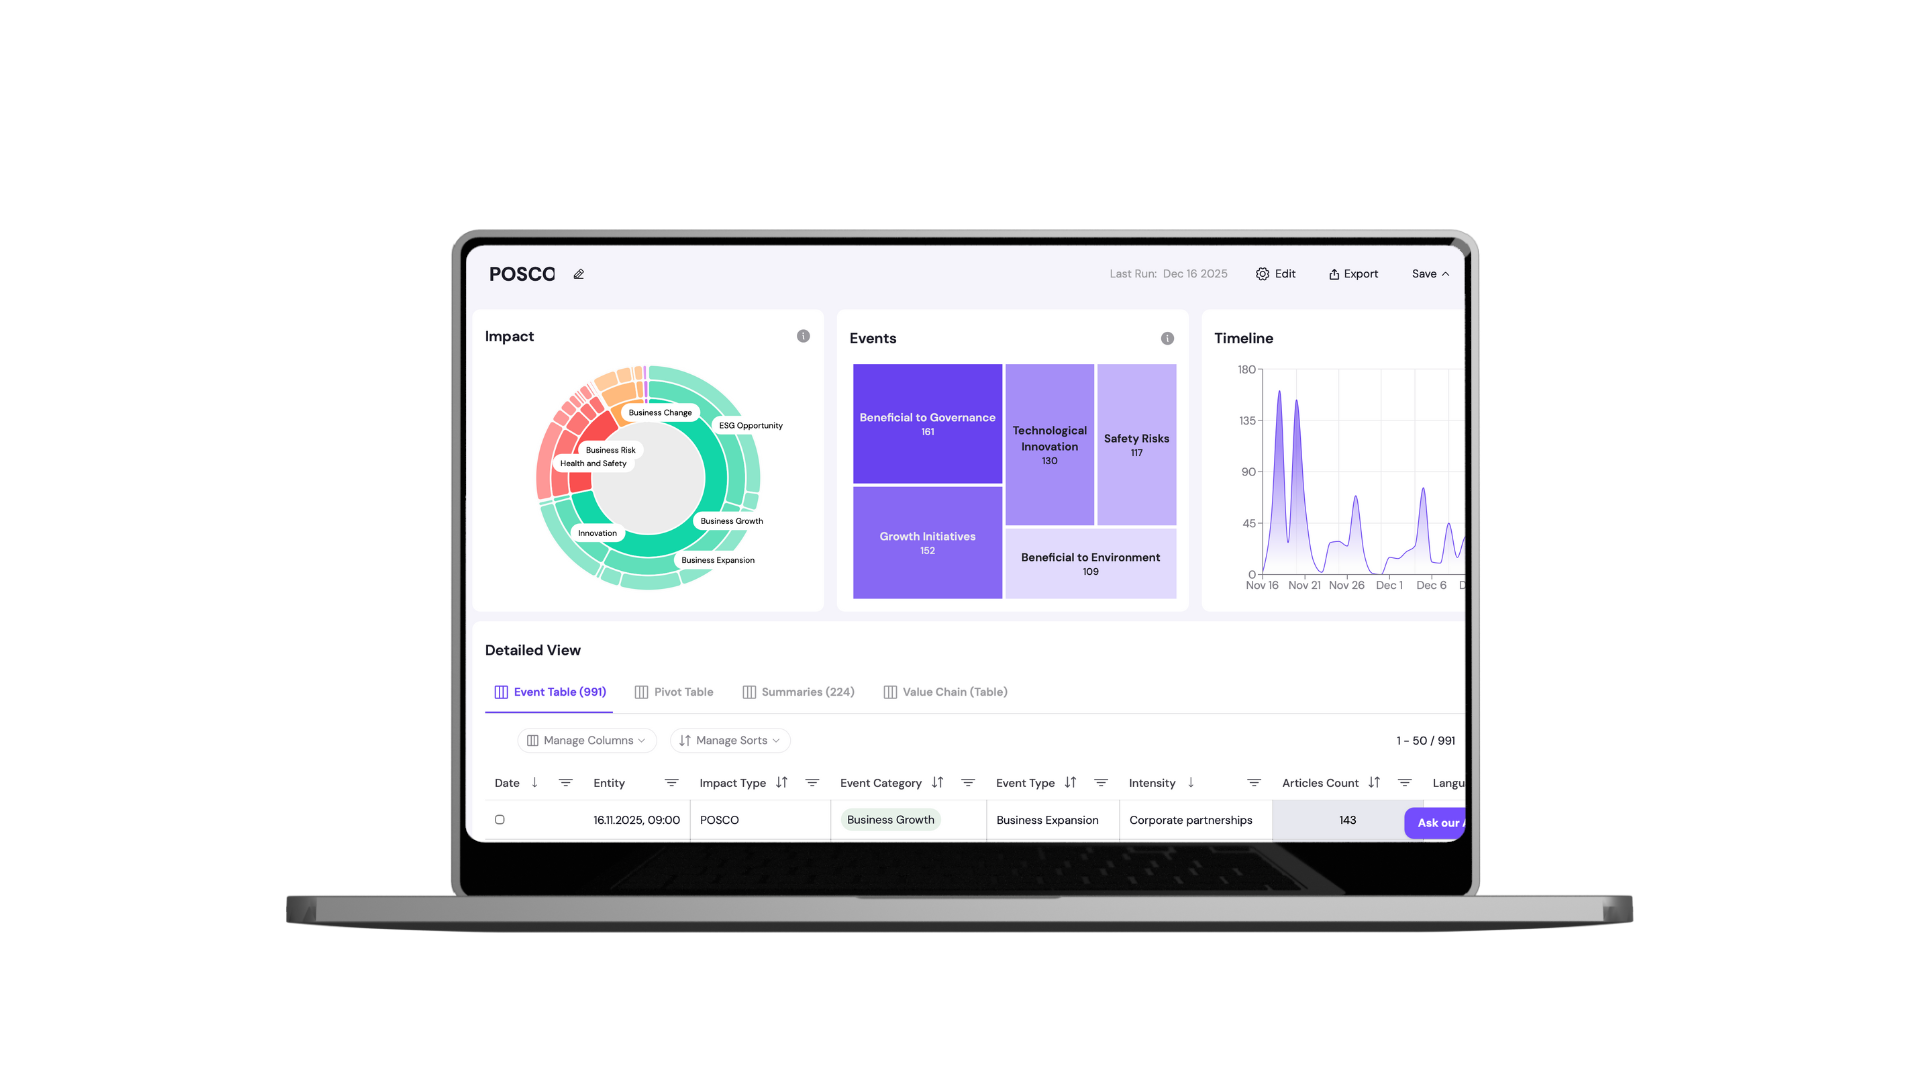
Step 5: Work with global OSINT data
- svEye scans global OSINT in 12 languages.
- You can switch titles to English at the top for easier reading.
Step 6: Use Smart Summaries
- Smart Summaries show how events evolved over time.
- They highlight:
- key moments
- intensity peaks
- overall narrative trends
Step 7: Use the AI Assistant
- The AI Assistant is available above the results.
- You can ask it to:
- summarize results
- explain trends
- answer follow-up questions
Step 8: Export your results
- Download all results as CSV or JSON.
- Use them in your own analytics or reporting tools.
Step 9: Wait for export notification
- Large exports are prepared in the background.
- You’ll receive an email when your file is ready.
How to get value from results faster
- Start with the timeline to spot spikes.
- Use Smart Summaries to understand context.
- Drill down only where signals look unusual.
Related tutorials

How to Use Company Health Score: Monitor Supplier Risk in Real-Time
How to Use Library & Alerts in svEye: Monitor What Matters Automatically

How to Analyze Value Chains in svEye: See Suppliers, Tiers, and Risk Exposure
See Everything. Focus on What Matters.
svEye™ filters the noise to uncover meaningful patterns and insights. Gain clarity, stay informed, and drive smarter decisions with a comprehensive overview.

