Walk your supply chain — upstream, downstream, or all the way through.
Value Chain turns the multi-tier supplier graph into something you can actually navigate. Click any company, pivot upstream to see its suppliers, downstream to see its customers, or full-stream to see both at once. Every node carries its real-time risk profile.
Included with every svEye subscription. Operates on any of the 10M+ indexed companies.
A list of suppliers is not a supply chain.
Most procurement, risk and ESG teams work from spreadsheets. Tier-1 names on one tab. A few tier-2 names on another. Maybe a network diagram in a deck. It's static. It doesn't show how a flood in Switzerland reaches a Porsche assembly line. It doesn't show that 73% of your tier-2 lithium traces to one Chinese province. It doesn't let you pivot from a supplier to its customers in one click.
You need to see the chain — and follow it in any direction the risk is moving.
Four things you'll do, every time you open it.
Pick any company in svEye. Open Value Chain. Then:
Navigate in any direction
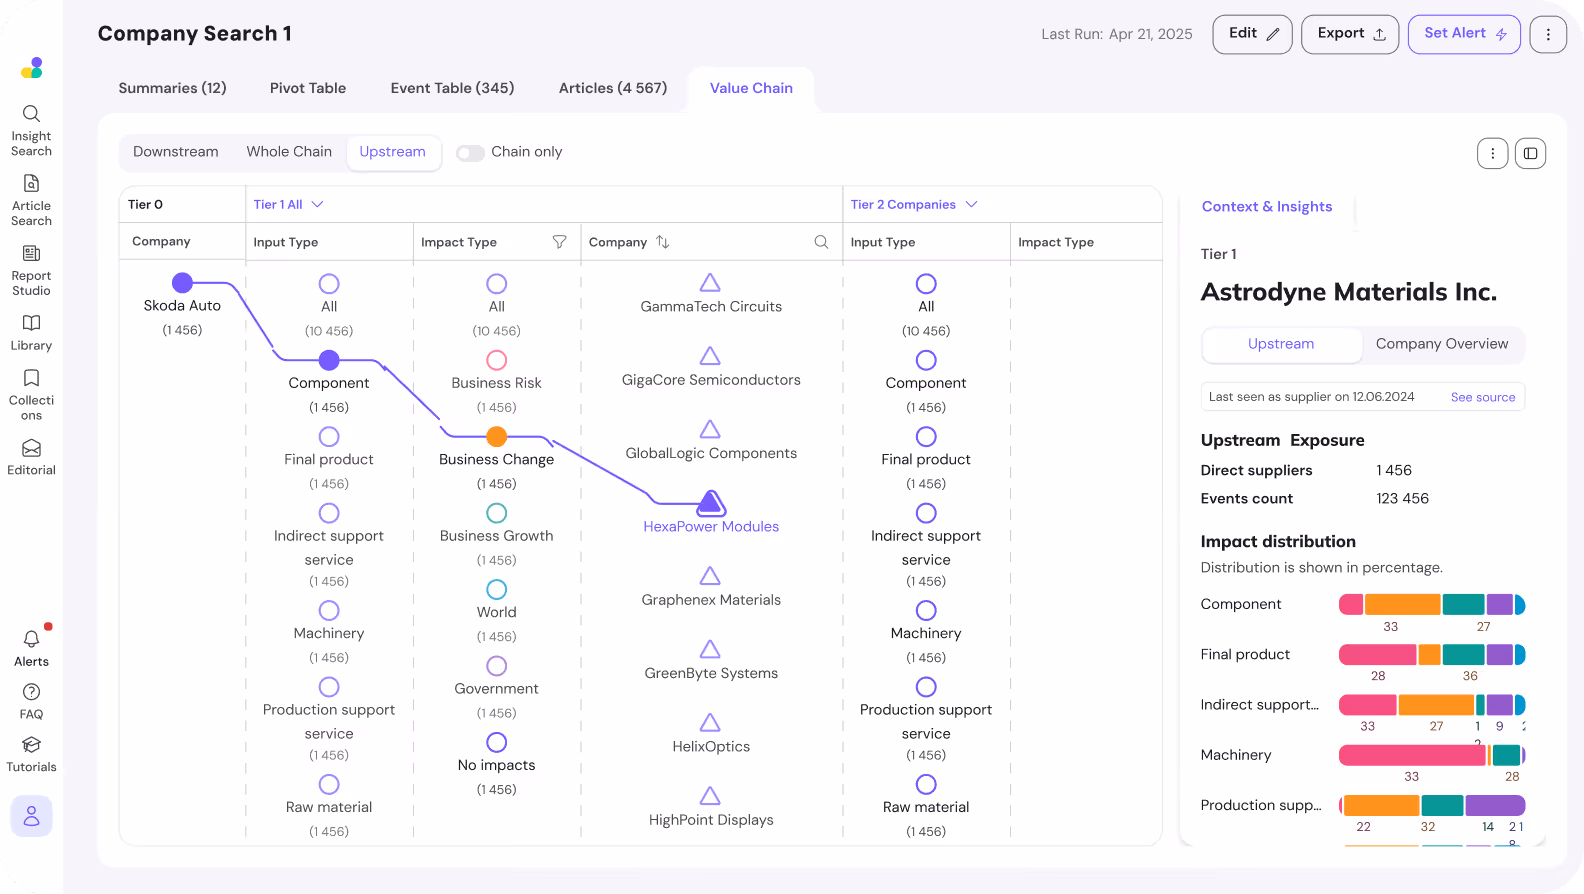
Switch between Down stream (who buys from this company), Up stream (who supplies it), or Full stream (both at once). Every tier — Tier 1, Tier 2, Tier 3+ — expands inline. No drilling through menus.
Filter what you see
Apply Impact type filters without leaving the view. Drill into Business Risk → Regulatory compliance → Corporate Governance Risk and the graph re-paints to show only entities and relationships matching that class. Same for opportunities, ESG categories, specific event types.
Read the context panel
Every node opens Context & Insights on the right — event category breakdowns, event types, exposure metrics (direct customers, events count), and impact distribution per input type (component vs final product vs raw material). The interpretation is built into the view.
Pivot on any company
Any node becomes a new starting company in one click. Investigating Toyota and want to look at its Tier-2 supplier BASF? Click BASF. The whole graph re-anchors. Investigation flows the way an analyst's thinking flows.
Three controls. Any chain. Any direction.
Pick a starting company
Search any of the 10M+ companies indexed in svEye. Toyota. BASF. Hindalco. Your own legal entity. Anyone on your watchlist. The selected company becomes Level 0 / Tier 0 — the centre of the graph.
Choose the direction
Three toggle states at the top of the view: Up stream (who supplies this company), Down stream (who this company supplies), Full stream (both directions in one canvas — useful when a single event ripples both ways from a node).
Expand tiers and filter
Each tier column expands inline — Impact type, Input type, Output type, Company. Filter columns by impact type (ESG, Cyber, Operational, Quality, Financial Risk and dozens more). Toggle Show Companies only for an entity-level view.
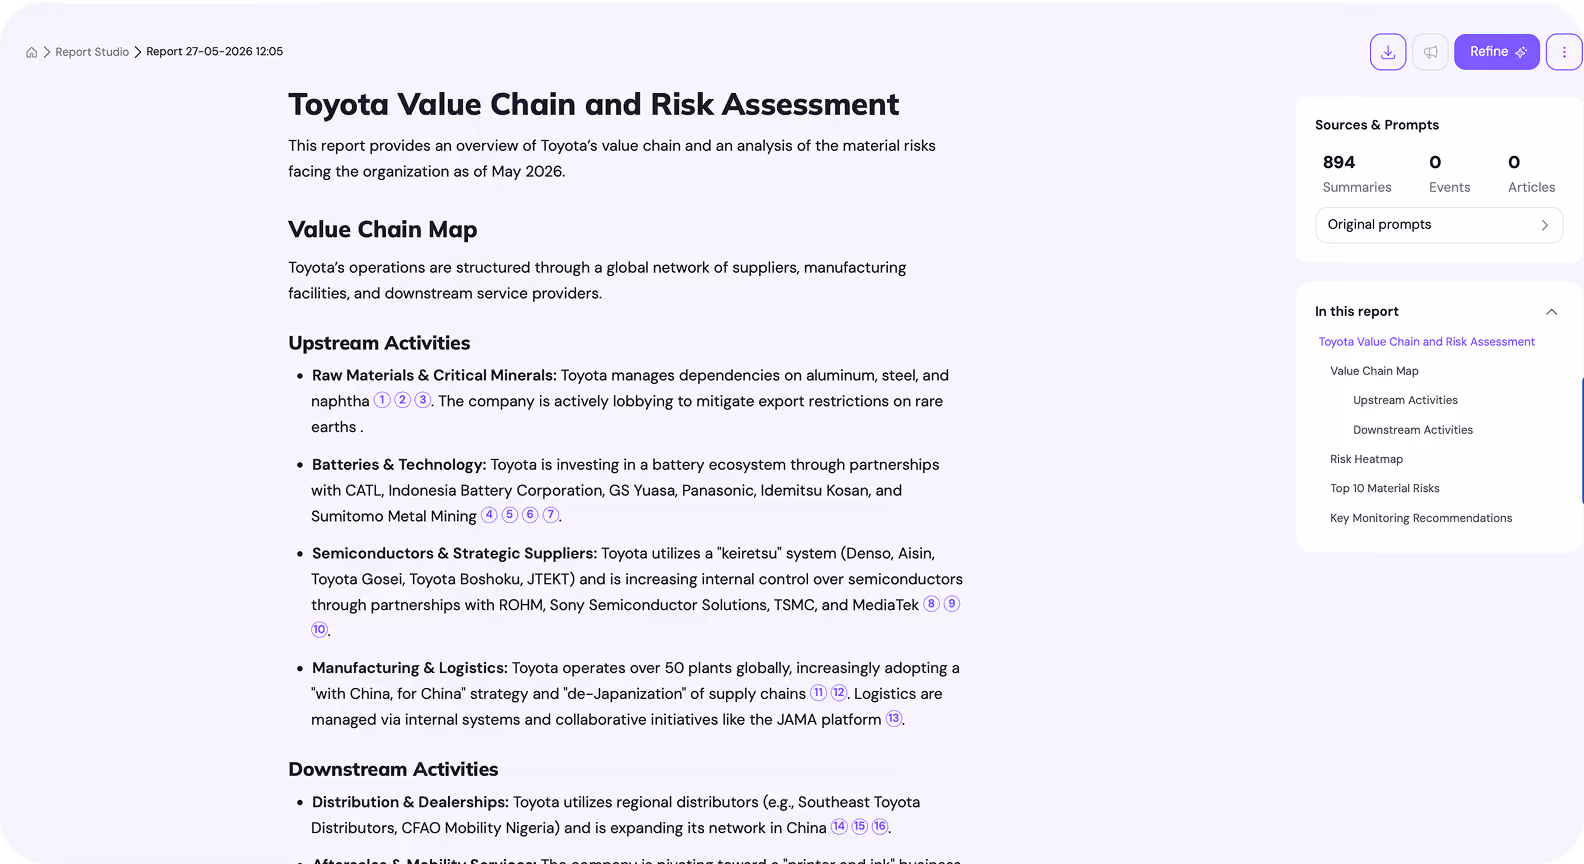
Where the data comes from. Value Chain visualizes the supplier graph maintained by the svChain product — built from OSINT, customs records (Bill of Lading), Bill of Materials data, and HS-code triangulation. The visualization is the surface. svChain is the engine. Learn how the graph is built
Risk interpretation, built into the canvas.
Every node you click opens an intelligence panel. This is where Value Chain stops being a diagram and starts being an analyst tool. Everything updates the moment you change a filter or click a different node — there is no "run report" button. The view is the report.
Value Chain is what you use.
svChain is what makes it possible.
Value Chain is a feature inside svEye and inside the custom dashboards we build for clients. Anyone with svEye access can open it on any indexed company.
But the graph it visualizes — multi-tier supplier relationships, validated through OSINT, customs records, and Bill of Materials — is the output of a much larger process. That process is svChain.
svChain is what onboards your supplier list, attaches HS codes, triangulates BoL data, ingests your BoM, runs continuous 24/7 detection across 720+ event types in 12 languages, and keeps the graph current. Value Chain is the place you walk through what svChain has built.
If you want to explore any company's network with the data we already have, Value Chain is enough. If you want your supply chain mapped — your suppliers, your products, your risk dimensions — that's svChain.
Visions
Monitoring
Vendors
Three real Mondays.
Cascading Impact
A Tier-2 aluminium supplier (Novelis) shows a SUPPLY_DISRUPTION event in Switzerland. You open Value Chain, set Down stream from Novelis, filter to Business Risk → Operational Risk. The graph re-paints to show every Tier-1 buyer downstream — Porsche, JLR, BMW — and the components each uses it for. You know which OEMs to call before lunch.
Concentration Risk · ESG
Preparing a CSDDD evidence pack, you open Value Chain on your own legal entity, set Up stream, Full Tier expansion, filter by Business Risk → ESG Risk. The Context panel surfaces that 38% of your indirect exposure concentrates in a single jurisdiction. Audit-trail starting point — with timestamped source events behind every node.
M&A Diligence
Evaluating a target, you open Value Chain on the target as Tier 0, Full stream, no filters. You spot a Tier-2 supplier flagged with Financial Risk and Legal proceedings. One click later you're on that supplier's company overview — events, sentiment, ownership changes. Diligence that took a week takes an afternoon.
Frequently asked questions.
Value Chain is the interactive supply-chain visualization feature inside Semantic Visions' svEye platform. It lets users navigate any company's supplier and customer network — upstream, downstream or full-stream — across multiple tiers, with real-time risk and opportunity context attached to every node. It is the in-app surface of the broader svChain product, which builds and maintains the underlying multi-tier supplier graph.
Traditional supply-chain diagrams are static images or PDF reports. Value Chain is a live, filterable, navigable graph. Users switch direction (upstream / downstream / full-stream), filter by impact type (Business Risk, ESG Risk, Cyber Risk, Operational Risk and many more), pivot the centre of the graph to any company in one click, and read a contextual intelligence panel on every node — including event category breakdowns, exposure metrics, and impact distribution per input type.
Yes. The Full stream view shows both directions on a single canvas — suppliers (upstream) and customers (downstream) — from any starting company. This is the view most analysts use for ripple-effect investigations, because a disruption rarely travels in only one direction.
Context & Insights is the right-side intelligence panel that opens whenever a node is selected. It shows a plain-English definition of the selected impact type, percentage breakdowns of event categories and event types, exposure metrics (direct customers count, total events count), and impact distribution across input types (component, final product, machinery, raw material, production support service). It removes the need to leave Value Chain to interpret a risk.
Any of the 10M+ companies indexed in svEye's entity graph. That includes publicly listed corporations, large private companies, and entities surfaced through customs records, regulatory filings, and OSINT. For mapping your own specific supplier network — including private and regional suppliers not in the standard index — see the svChain product, which onboards your supplier list and Bill of Materials.
Yes. Value Chain is included with every svEye subscription as a standard feature, alongside Summaries, Pivot Table, Event Table, Intelligence Assistant and the rest of the platform. There is no separate seat or quota. For clients who want a fully mapped, continuously monitored supplier graph based on their own entity universe and Bill of Materials, svChain is the corresponding product.
Tier-2 and tier-3 relationships come from the svChain mapping process — which triangulates open-source intelligence, customs records (Bill of Lading data), Harmonized System codes, and customer-provided Bill of Materials to discover supplier-buyer relationships that aren't publicly disclosed. Tier-2 and tier-3 nodes carry the same filter logic, context panel, and pivot behaviour as Tier-1 nodes.
See your own supply chain in Value Chain.
A 30-minute walkthrough on a sample of your suppliers, customers, or portfolio companies. We'll show you the upstream, downstream, and full-stream views — and the risk concentrations most teams don't know they're carrying.

