
How to Read Results in svEye: Summaries, Pivot Table and Event Table
When you run a search, svEye opens the results view. This guide explains the result tabs, the charts, and how to get the most out of the Summaries, Pivot Table and Event Table.
Summaries explain, events measure
svEye gives you two kinds of output. Summaries are narrative accounts written for people to read. Events are discrete, point-in-time records, better suited to systematic analysis and to use in other systems.
That is why the counts differ. One situation is usually reported in many articles and produces many individual events, which are consolidated into far fewer summaries. Nine thousand events and one thousand summaries is not a contradiction. It is the same reality at two resolutions.
The four result tabs
The tabs show the same result set at different levels of detail. You can switch between them freely: the search does not run again.
Value Chain has its own guide in this series.
Charts
The Charts panel sits above the results on the Summaries, Pivot Table and Event Table tabs. Expand it for a visual overview before you read anything in detail.
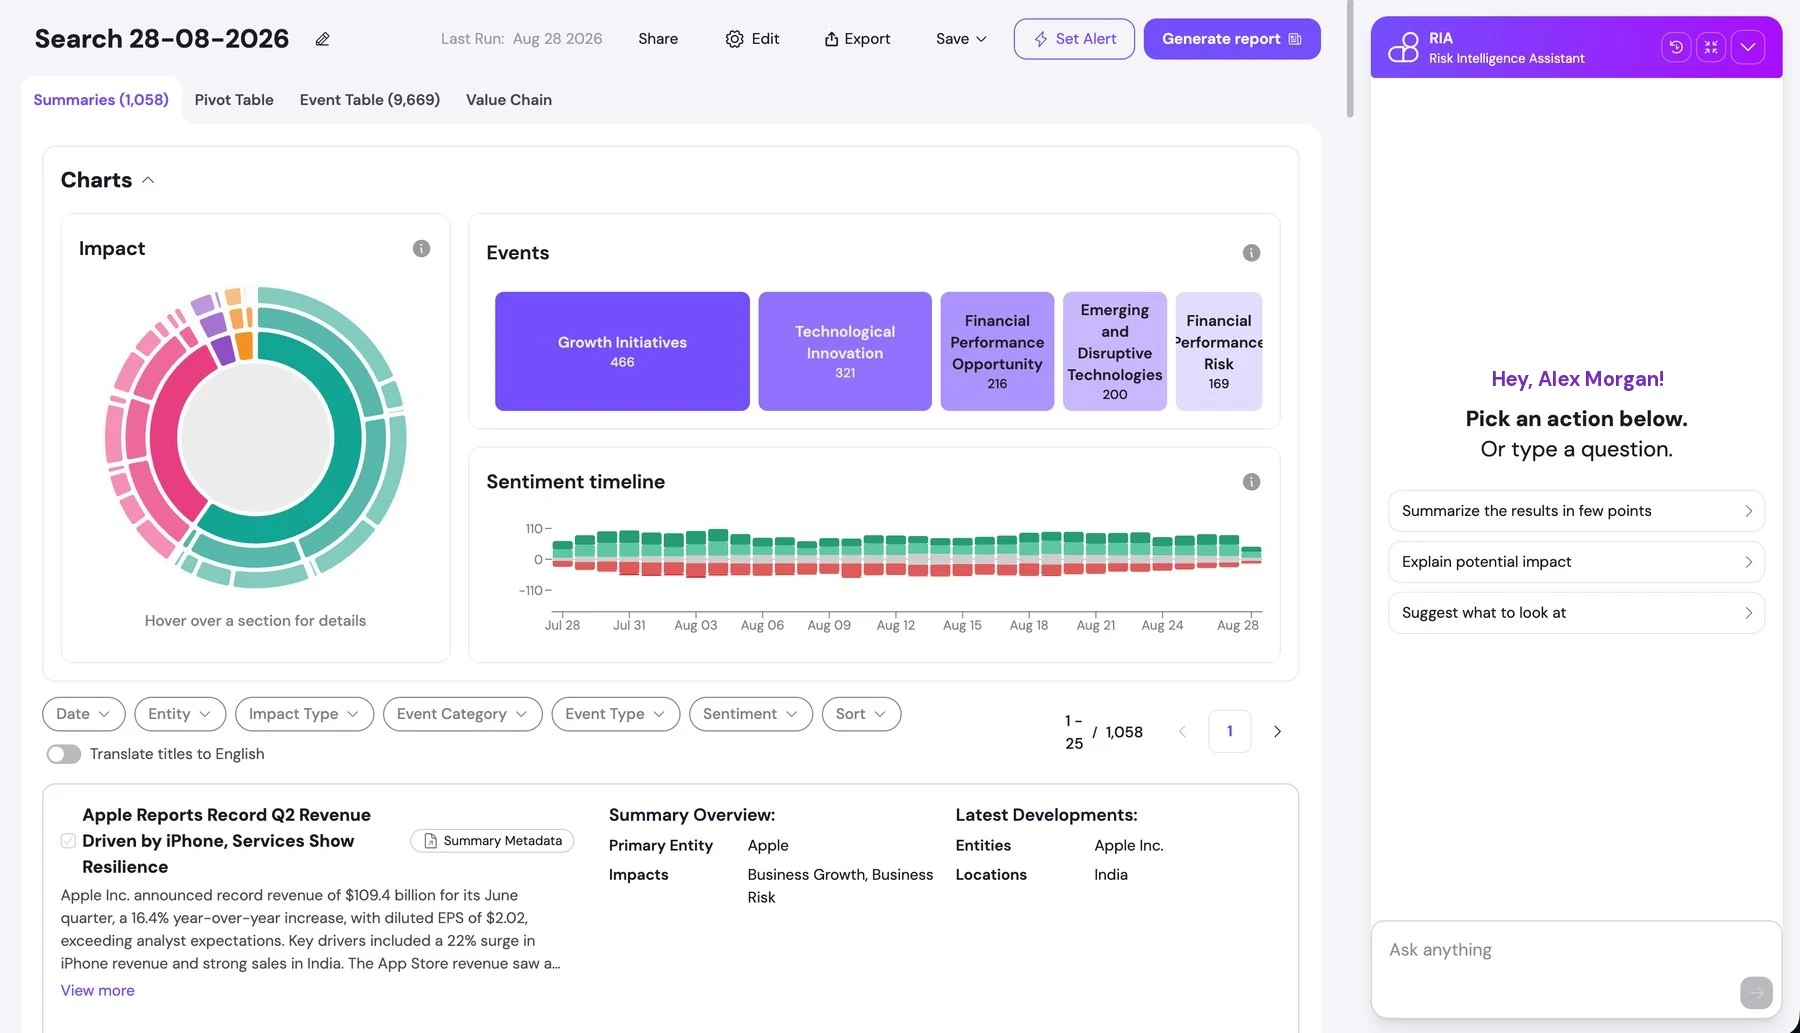
- Impact: a ring chart showing how results are spread across the classification hierarchy, with impact type in the inner ring. Hover over a segment for details.
- Events: the most frequent event types in the result set, sized by volume, with counts. Use it to see what is driving the numbers.
- Sentiment timeline: positive and negative coverage over the search period. Changes in the balance over time often tell you more than the absolute level. A sustained move toward negative coverage is a signal in itself.
The charts are interactive and act as filters. Click into a chart to narrow the results below it, without going back to the filter panel.
Summaries
A summary is a narrative account of a developing situation involving one of your entities. It is built from all the reporting svEye has detected and is updated as the situation evolves.
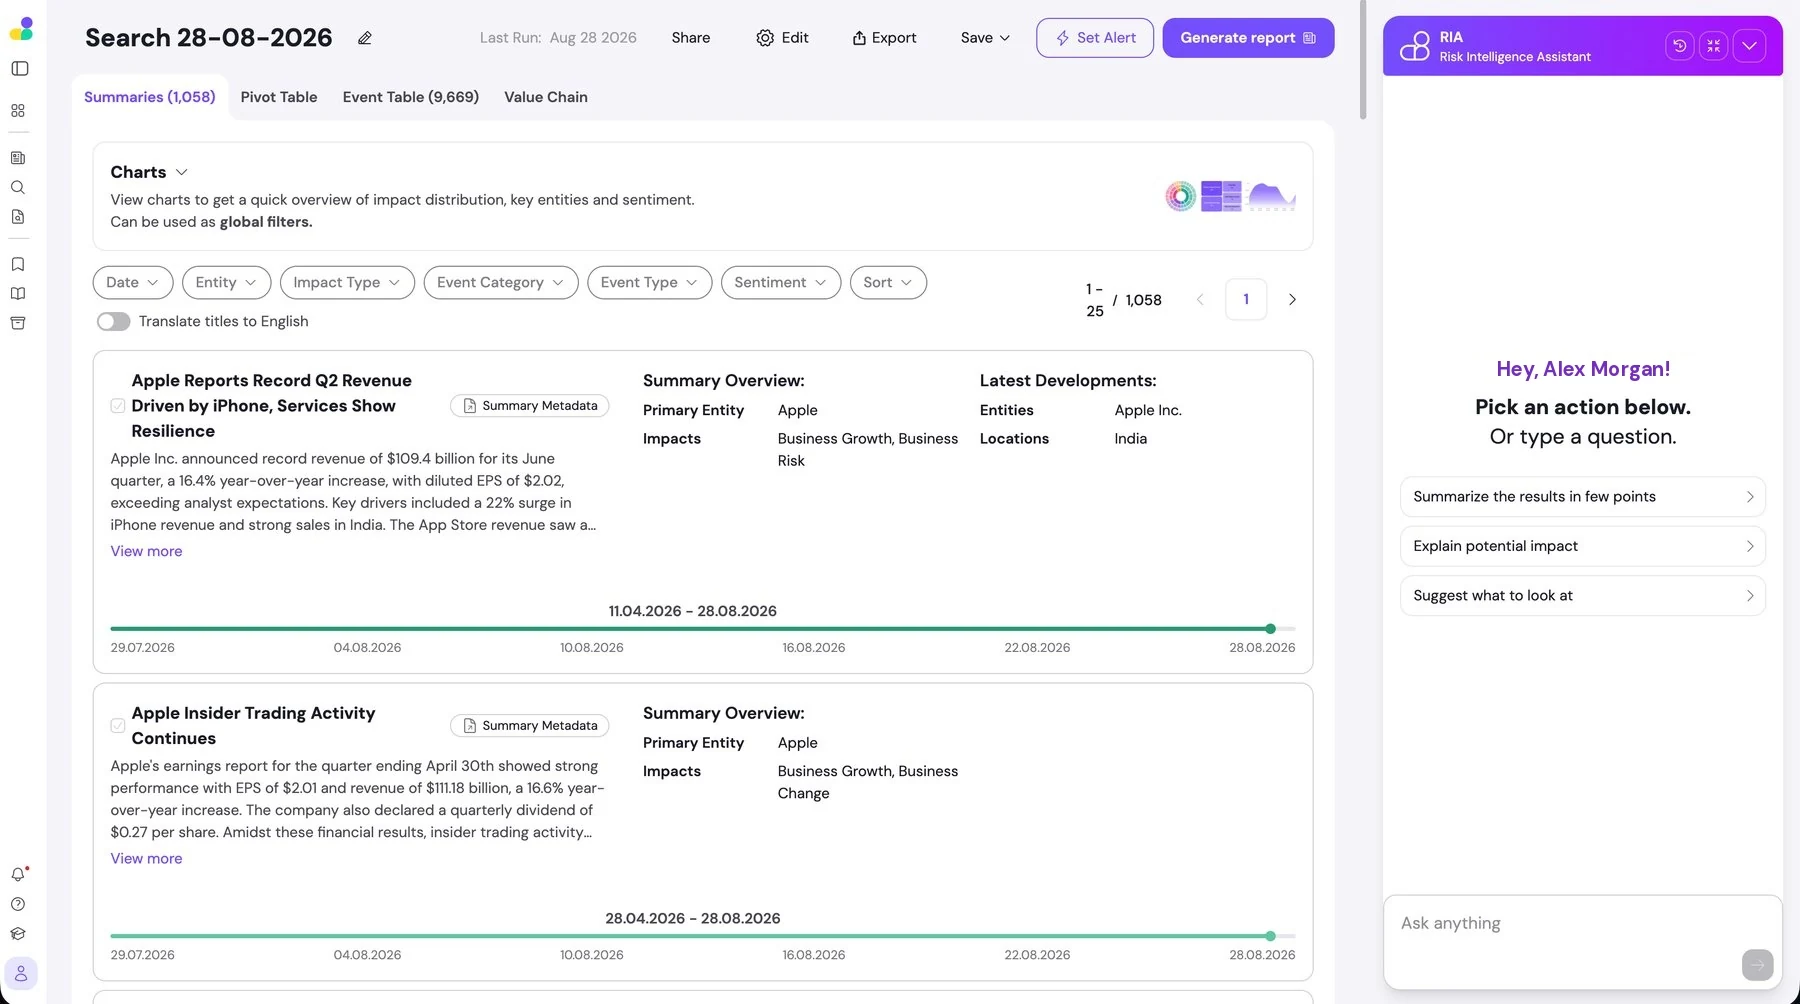
Each summary card contains:
- Title and text: the opening of the account. View more expands the full text.
- Summary Overview: the main entity the summary is about, and the impact types involved.
- Latest Developments: entities and locations that appear in the most recent reporting.
- Coverage timeline: a bar showing the period the summary covers, with a marker at the latest development. A bar spanning several months points to an ongoing situation rather than a one-off incident.
- Selection checkbox: selects summaries for export.
Above the list, filter chips narrow the results by Date, Entity, Impact Type, Event Category, Event Type and Sentiment, and Sort sets the order. These work within the results you already have and do not run the search again. Translate titles to English shows non-English titles in English, which helps when you scan a multilingual result set. Results are paginated, with the current range and total shown on the right of the filter bar.
Pivot Table
The Pivot Table groups the result set in a hierarchy: entity, then event type, then date, then the individual articles behind each event. This is the evidence tab. If svEye reports a legal proceedings risk for a company on a given date, the Pivot Table shows you the articles behind that classification, so you can read them and judge for yourself.
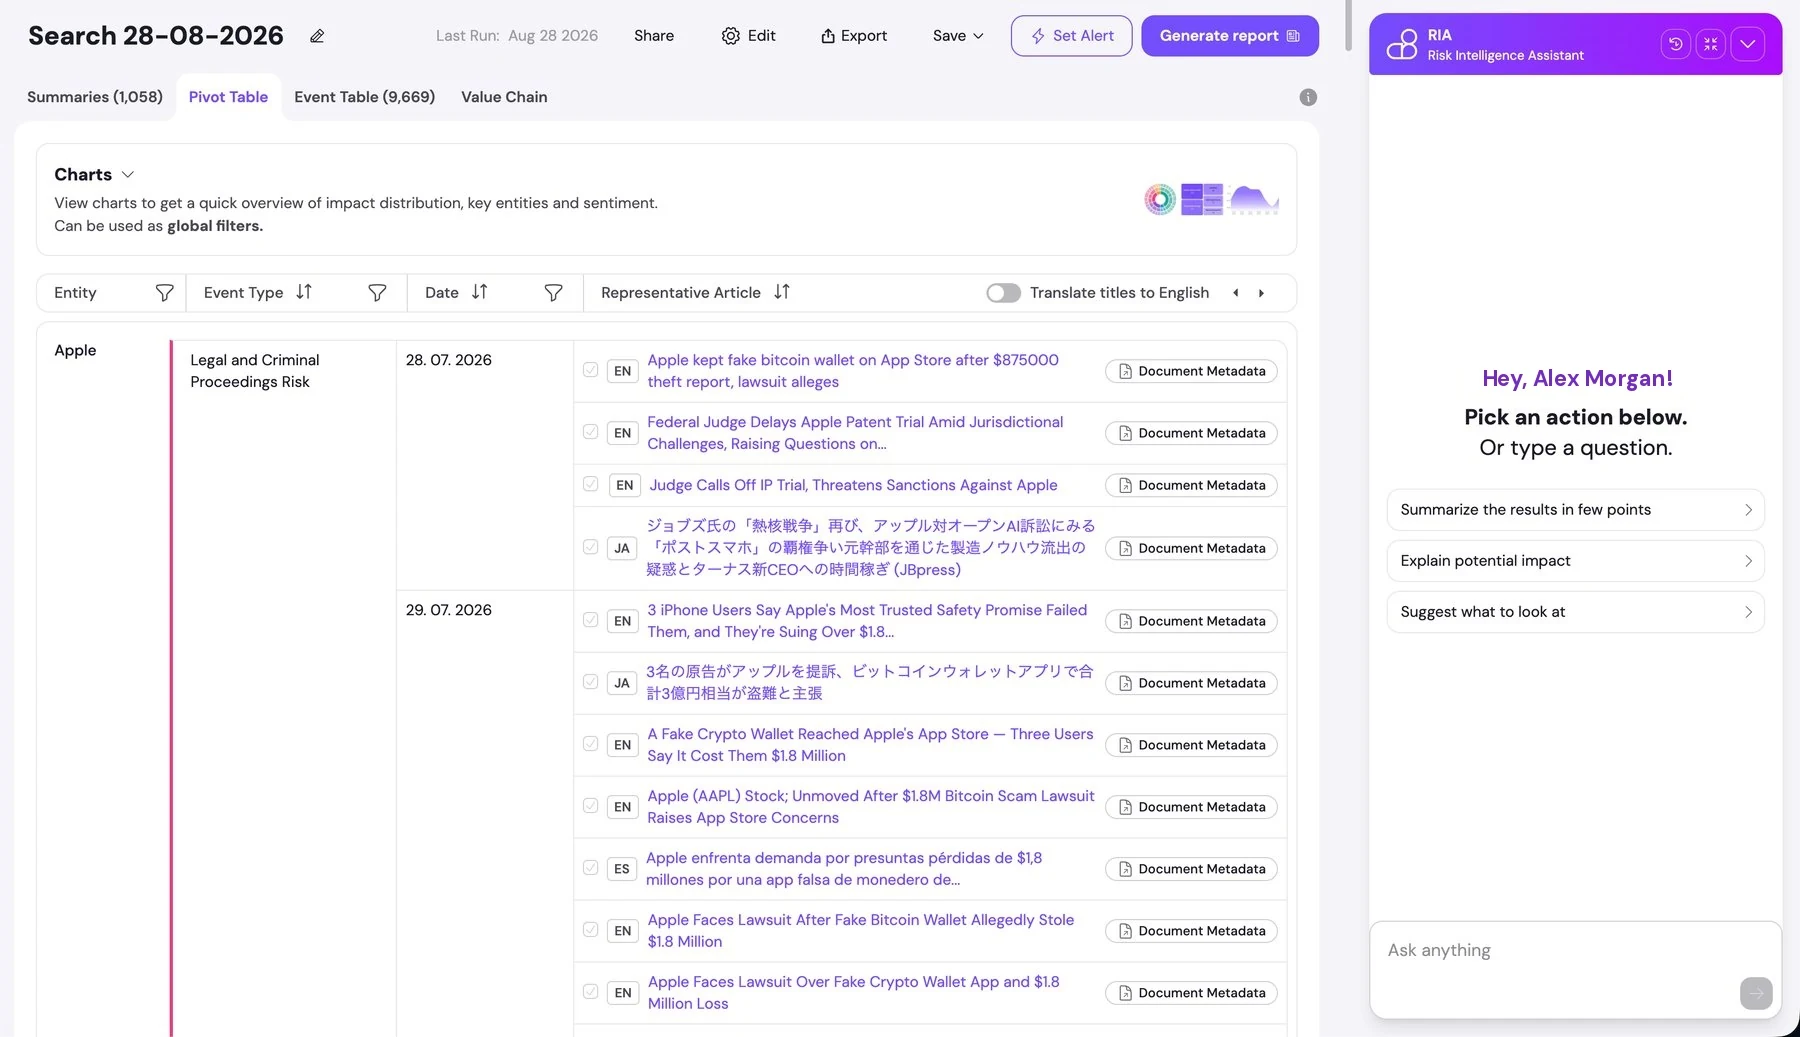
- Each article row has a language badge showing the language of the original publication, and the article title as a link.
- A coloured bar on the left of each group shows the impact type, in the same colours used across svEye.
- You can sort and filter Entity, Event Type and Date independently.
A multilingual group is a signal: when the same event is covered in English, Japanese and Spanish sources, it is being reported internationally. When it appears in only one local language, it may not have surfaced elsewhere yet. That is often the moment when the information is most valuable.
Event Table
The Event Table lists every event in the result set as one row with all its attributes. It is the most detailed view and the right one for filtering, sorting, counting and exporting. The table is wider than the screen and scrolls horizontally.
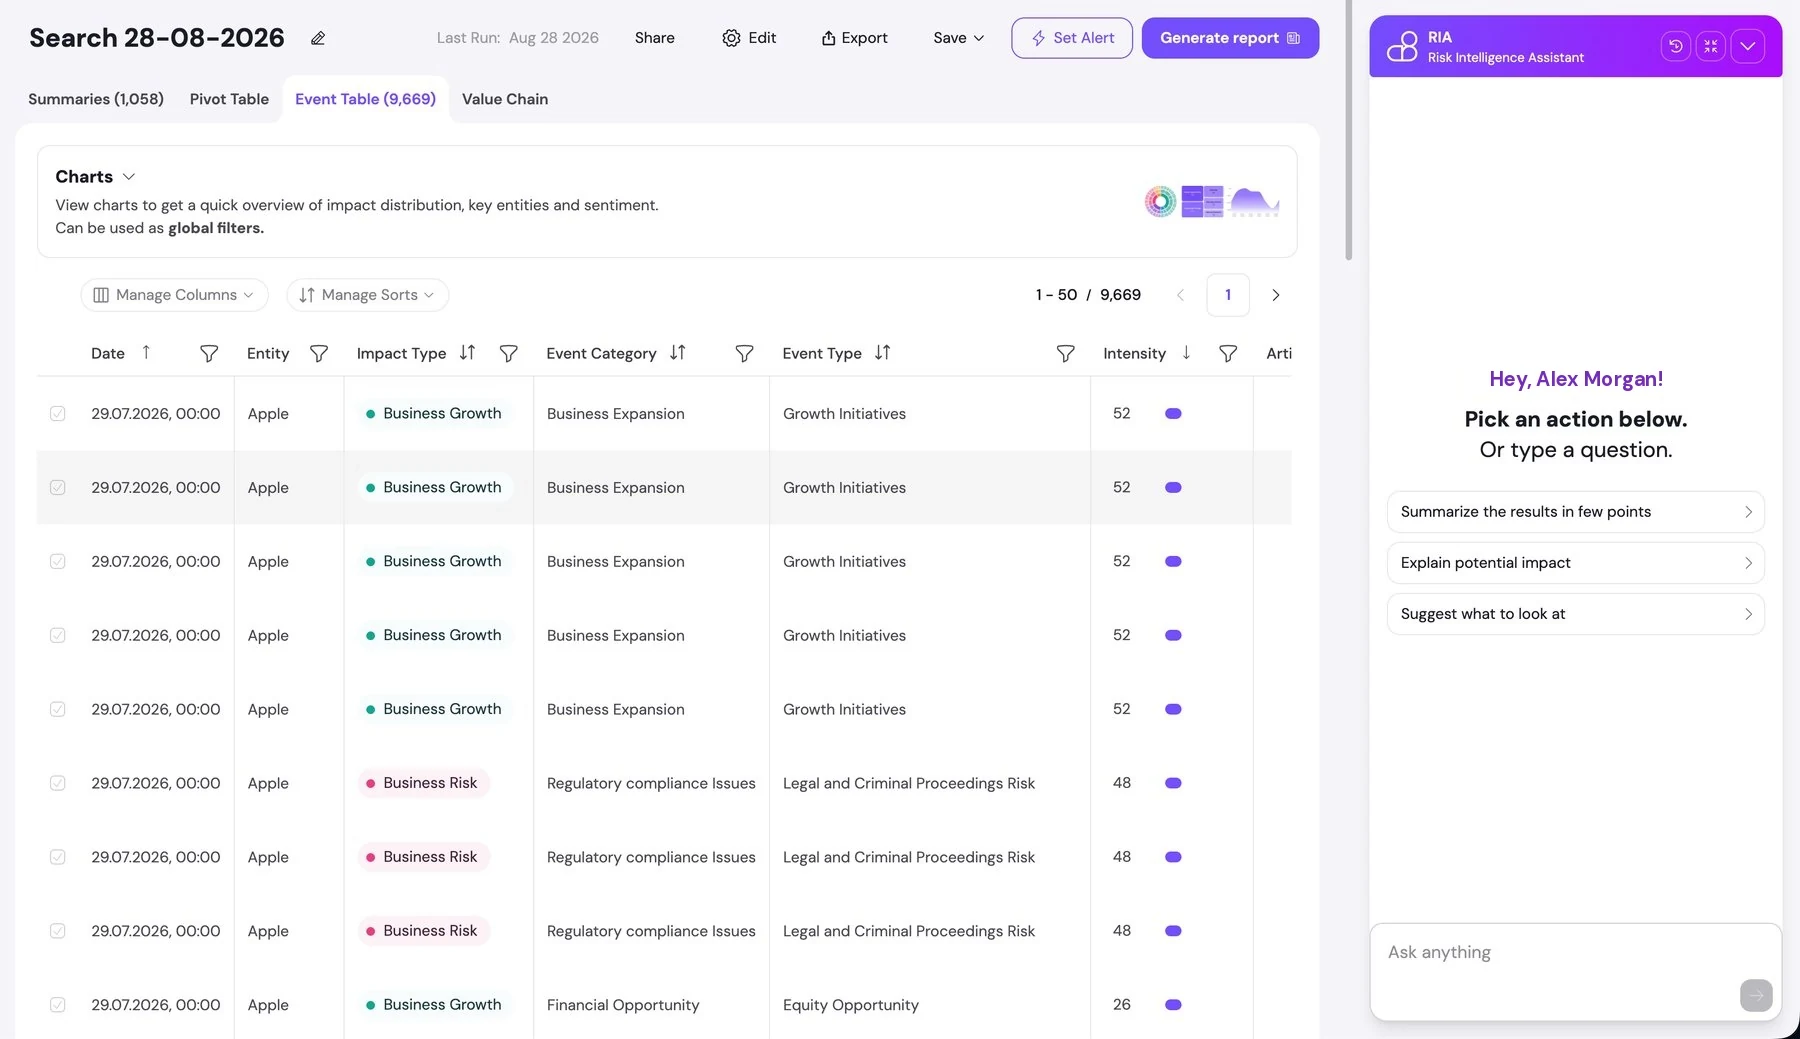
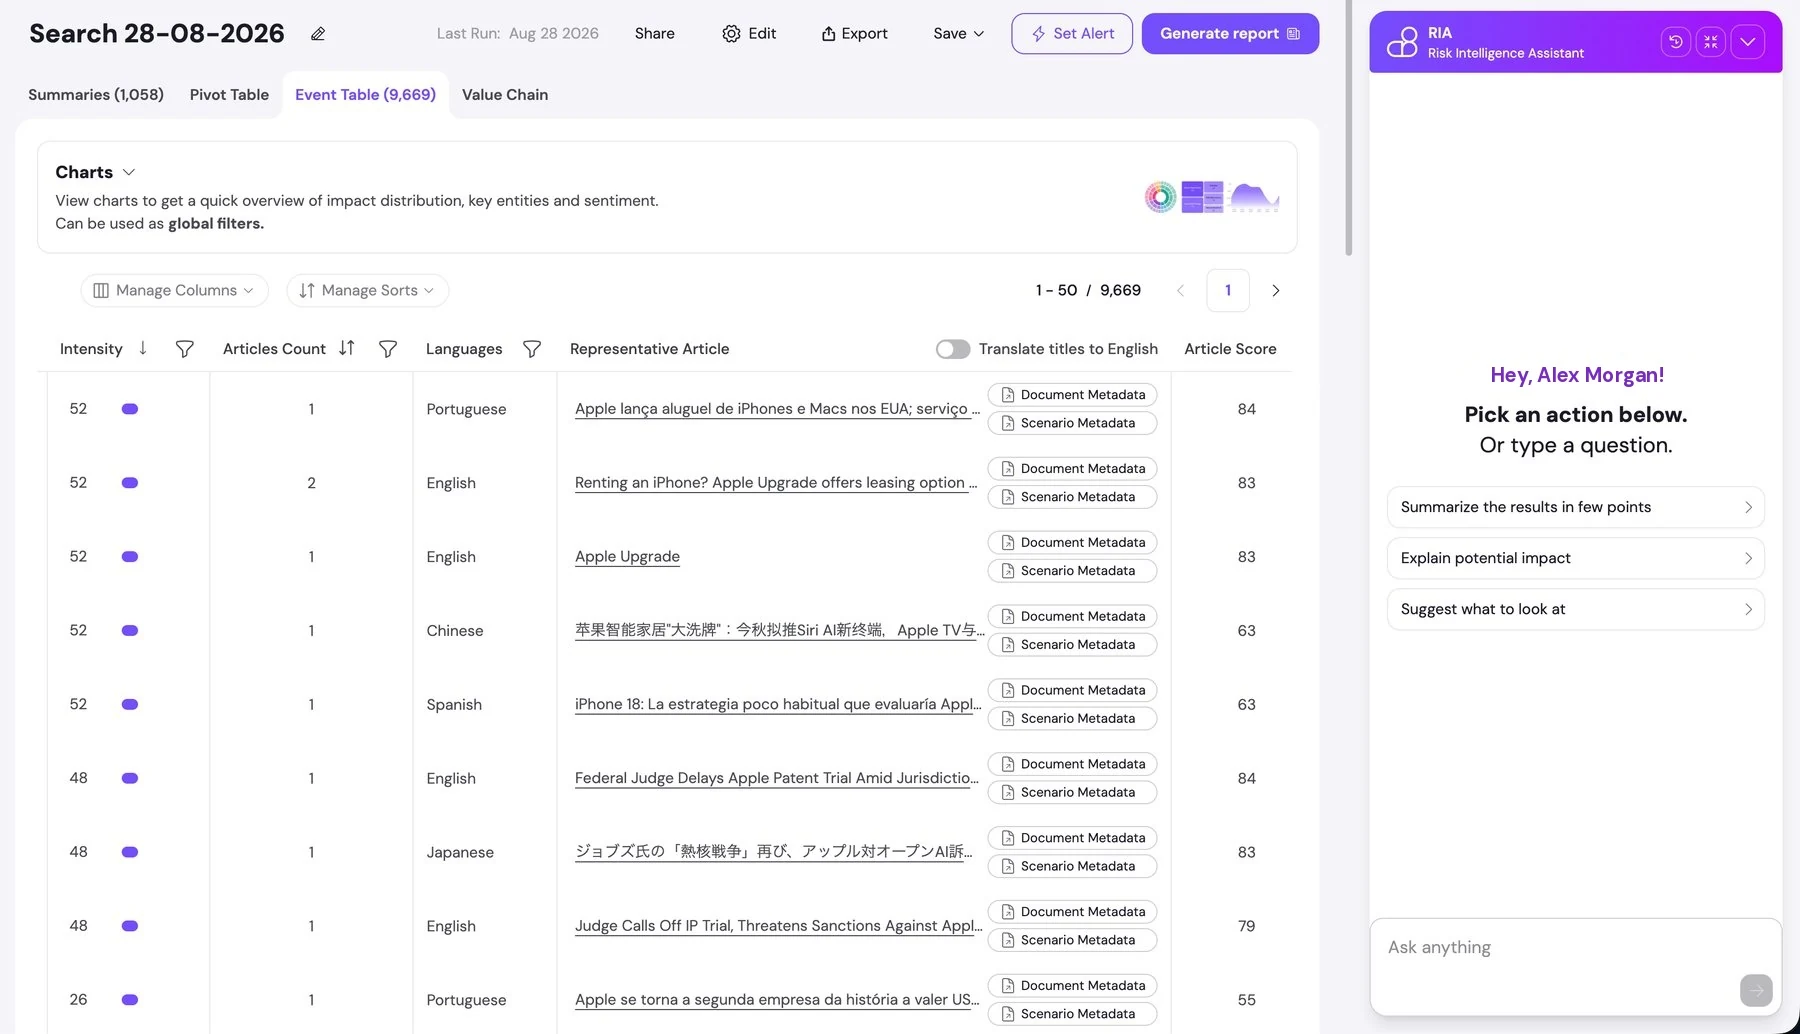
A high Article Score means the article is squarely about the event. A lower score means the event is present but peripheral to the article.
Two controls above the table decide what you see and in what order. Manage Columns lets you show only the columns you need. Manage Sorts sorts by several columns at once, for example intensity descending within date descending. Each column header also has its own sort and filter controls.
Two combinations worth knowing:
- Intensity, descending: shows the topics that dominate coverage of your entities.
- Articles Count, filtered upward: keeps only events confirmed by several independent articles. This is useful when a single report is not enough to act on.
Use the Event Table when your question is "how much", "how often" or "since when". When the question is "what is going on", the Summaries tab gets you there faster.
Next in this series
Related tutorials
How to Use RIA, the svEye Risk Intelligence Assistant
How to Analyze Value Chains in svEye: Suppliers, Tiers and Risk Exposure
How to Save, Share, Export and Set Alerts in svEye
See Everything. Focus on What Matters.
svEye™ filters the noise to uncover meaningful patterns and insights. Gain clarity, stay informed, and drive smarter decisions with a comprehensive overview.

