


Picture a familiar Monday. Your dashboard shows every Tier 1 supplier operating normally. No alerts, no adverse media, no late shipments. Then procurement reports that a component has gone on allocation, and within days the line is short. The cause turns out to be a small processor two tiers upstream that supplies three of your "independent" Tier 1 vendors. Nobody on your watchlist was in trouble. The company that mattered was not on your watchlist at all.
This is the most common way concentration risk surfaces. It rarely appears as one large supplier failing. It appears as a quiet overlap, a shared sub-tier supplier, a shared port, a shared region, a shared raw material, that makes supposedly diversified suppliers behave like a single one when something goes wrong.
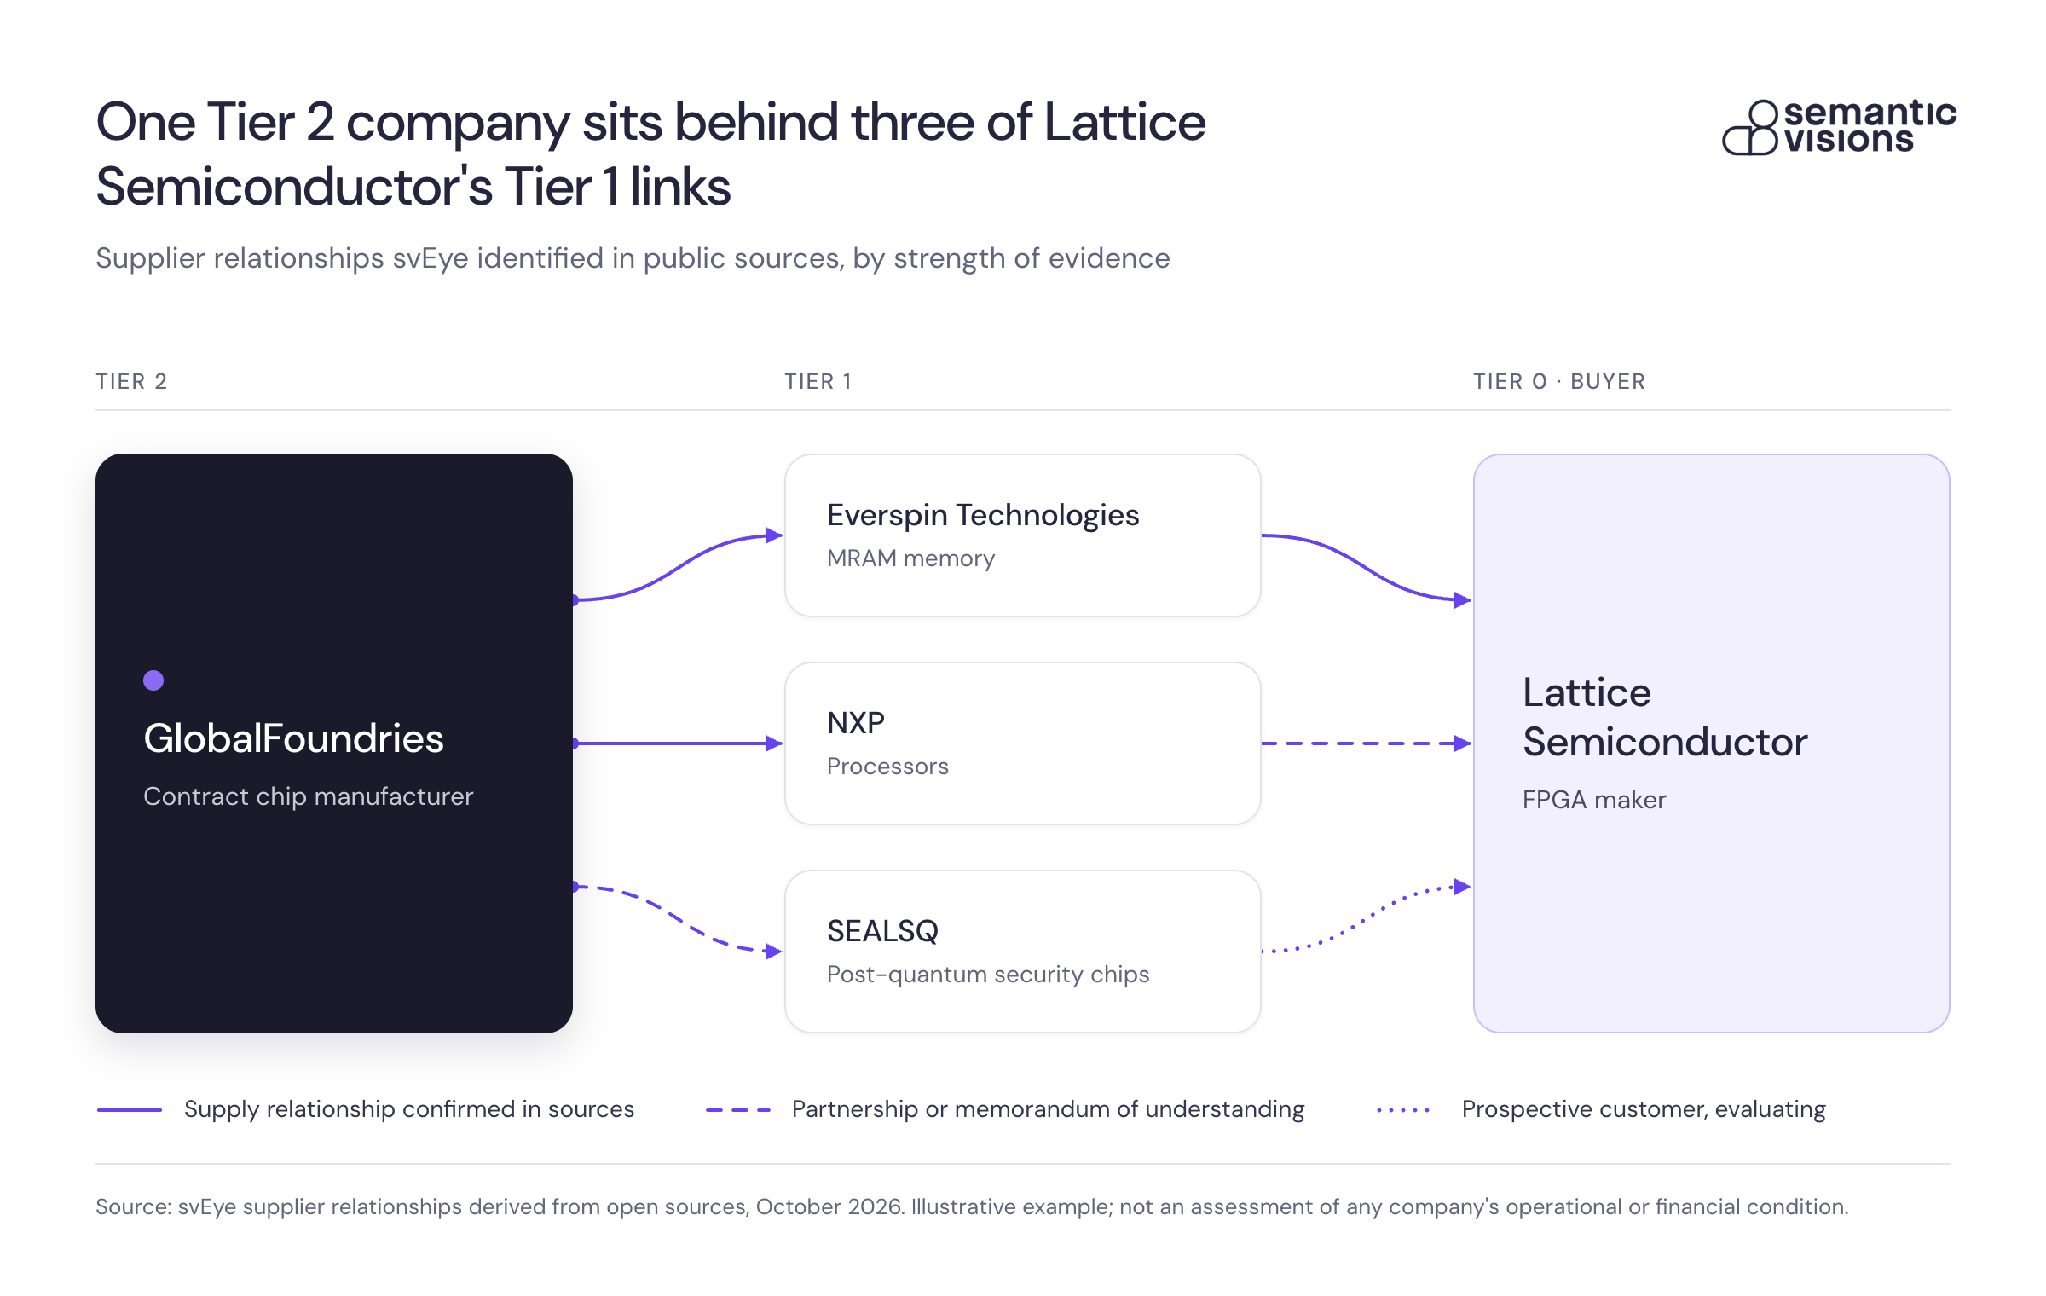
Here is what that overlap looks like in public data. In svEye’s relationship graph, GlobalFoundries sits behind three of Lattice Semiconductor’s Tier 1 links. The links are not equally strong: one path is a confirmed supply relationship, while the others rest on a partnership, a memorandum of understanding and a product evaluation. That difference matters, because every link should trace back to a source an analyst can check and challenge.
This post explains how to get supply chain visibility beyond Tier 1 suppliers, and how to design a detection approach that surfaces concentration risk before it becomes a production problem. It is written for risk, procurement, and intelligence teams who already know that Tier 1 is not enough and want a practical way to act on that knowledge.
Why Tier 1 visibility hides the real single points of failure
Concentration risk, in plain terms, is the degree to which your outcomes depend on the same few things. Those things may be companies, but they may equally be materials, processes, facilities, geographies, logistics nodes, or certifications. When several suppliers rely on the same upstream element, a single event produces correlated failures. Your supplier count looks healthy. Your effective diversification is far smaller.
Tier 1 monitoring misses this by design. Tier 1 suppliers are the ones you contract with, assess, and audit, so they receive the attention. But the volume of events happens elsewhere. In a structured one-week observation of the multi-tier supplier networks of 27 leading semiconductor companies (November 17 to 23, 2025), Semantic Visions found that Tier 3 suppliers generated approximately 360 times more operational risk events than Tier 1 suppliers in the same window. The full methodology is in our quantitative look at where disruptions originate. The sample is one industry and one week, so treat the ratio as an illustration of where events cluster rather than a universal constant. The direction is still hard to ignore: the further upstream you look, the more is happening, and the less of it you currently see.
Frameworks from McKinsey, KPMG, and the UK National Cyber Security Centre agree on the principle. McKinsey urges companies to assess vulnerabilities across supplier networks, logistics, financial resilience, and product complexity. KPMG's 2026 article on multi-tier supplier risk argues that managing beyond Tier 1 is now a mandate. NCSC offers a sensible starting point for mapping. What these sources leave open is the practical question: what exactly do you map, what do you measure, and what triggers action? The rest of this article addresses that gap.
What "beyond Tier 1" means in practice
Three things are often conflated, and separating them clarifies what you are building.
- A supplier inventory is a list of names. It answers "who do we pay?"
- Relationship mapping connects those names to the entities they depend on. It answers "who supplies our suppliers, and from where?"
- Concentration-risk detection watches those relationships for overlap and change. It answers "where are we exposed to the same failure through different doors, and is anything changing?"
Most organizations have the first, some have a partial version of the second, and very few have the third. A longer supplier list does not move you from one to the next. A list of 5,000 suppliers with no relationships is still a list.
A workable minimum scope is Tier 2 and Tier 3 dependency signals for your critical categories, plus the ability to trace how an upstream event propagates to the relationships it touches. Guidance such as NIST's supply chain risk management publication (SP 800-161) points in the same direction by asking organizations to consider suppliers beyond their direct ones. You do not need to map everything. You do need to map the parts of the network where a failure would stop you.
A four-step operating model for concentration-risk early warning
KPMG describes multi-tier supplier risk management as four steps: Map, Segment, Establish Dynamic Controls, and Govern Continuously. It is a sound skeleton. Below is how each step looks when the objective is specifically concentration risk.
Step 1: Map from evidence, not declarations
Supplier questionnaires and contract data tell you what a supplier says about its own sources, usually on a cycle measured in months and usually stopping at Tier 1 or Tier 2. Useful mapping combines three inputs: your own procurement and bill-of-materials data, supplier disclosures, and relationships discovered in open sources such as news, trade press, regulatory filings, and local-language reporting.
The evidence-based layer matters because it catches what nobody told you. Our svChain mapping layer derives OSINT-based supplier relationships up to three tiers deep, with deeper multi-tier mapping available as a service. Each relationship traces back to a source, so an analyst can see where a link came from and challenge it if necessary.
Entity resolution deserves attention here. A single company may appear under a legal name, an abbreviation, a transliteration, or a local-script variant, and a subsidiary may be reported without its parent. If those variants are not resolved to one entity, two suppliers that are actually the same company look unrelated, and the concentration is invisible. Semantic Visions resolves entities across name variants, abbreviations, diacritics, and non-Latin scripts, and distinguishes parent, subsidiary, and branch.
Step 2: Segment dependencies by risk logic
Once relationships are mapped, group them by the reason they concentrate. Useful segments include:
- Shared upstream companies (the same Tier 2 supplier behind several Tier 1 vendors)
- Shared materials or processes (a single refining step, a single specialty chemical)
- Shared geographies (clusters in one region, one flood plain, one jurisdiction)
- Shared logistics nodes (the same port, rail corridor, or freight operator)
- Shared certifications or compliance regimes (a single audit body, a common sanctions exposure)
Segmenting this way converts a sprawling graph into a short list of questions. Instead of "how risky is our supply chain?", you ask "which five dependencies would hurt most if they failed together?" Tools that let you walk a network upstream, downstream, or end to end, such as the Value Chain feature in svEye, make that exercise faster than assembling spreadsheets by hand.
Step 3: Establish dynamic controls
A static risk rating assigned at onboarding does not help when conditions change weekly. Dynamic controls define in advance what moves a dependency from "watch" to "escalate." Three rule types cover most needs:
- Thresholds: for example, a critical sub-tier supplier shows a set number of distinct operational events in a rolling window.
- Change events: a new relationship appears, a facility changes ownership, a supplier is added to a sanctions or enforcement list.
- Corroboration rules: an escalation requires at least two independent sources, or a primary-source confirmation, before it reaches leadership.
Corroboration rules protect analyst credibility. They reduce false alarms without hiding weak signals, because weak signals stay on the watchlist until another source confirms them.
Step 4: Govern continuously
Supply networks change. Suppliers win and lose customers, plants relocate, and ownership shifts. A map built once and filed away begins decaying immediately. Continuous governance means monitoring runs on a defined cadence, the dependency graph is updated when new relationships are found, and someone owns approving those changes. Without named owners, the map becomes a project deliverable rather than an operating tool.
What to measure: leading indicators for supplier concentration risk
Concentration alone is a structural fact. It becomes a risk when something starts happening to the shared element. So the monitoring layer needs indicators that move before Tier 1 feels the impact. Four categories are a practical starting set, and you should adapt them to your sector.
Upstream continuity signals. Production stoppages, labor disputes, fires, power or water shortages, plant closures, and insolvency indicators at sub-tier suppliers. These are the earliest and most direct predictors of downstream shortage.
Compliance and regulatory shocks. Sanctions exposure, forced-labor allegations, export-control actions, and sector enforcement signals. A single enforcement action against a shared Tier 2 supplier can interrupt several Tier 1 relationships at once.
Cyber and operational integrity signals. Ransomware incidents, system outages, or data breaches at suppliers or logistics operators. These are often reported publicly before the affected company communicates with customers.
Geographic and infrastructure vulnerability. Weather events, port congestion, civil unrest, or infrastructure failures in regions where your mapped dependencies cluster. The map tells you which events matter to you. Without it, the same headline is just news.
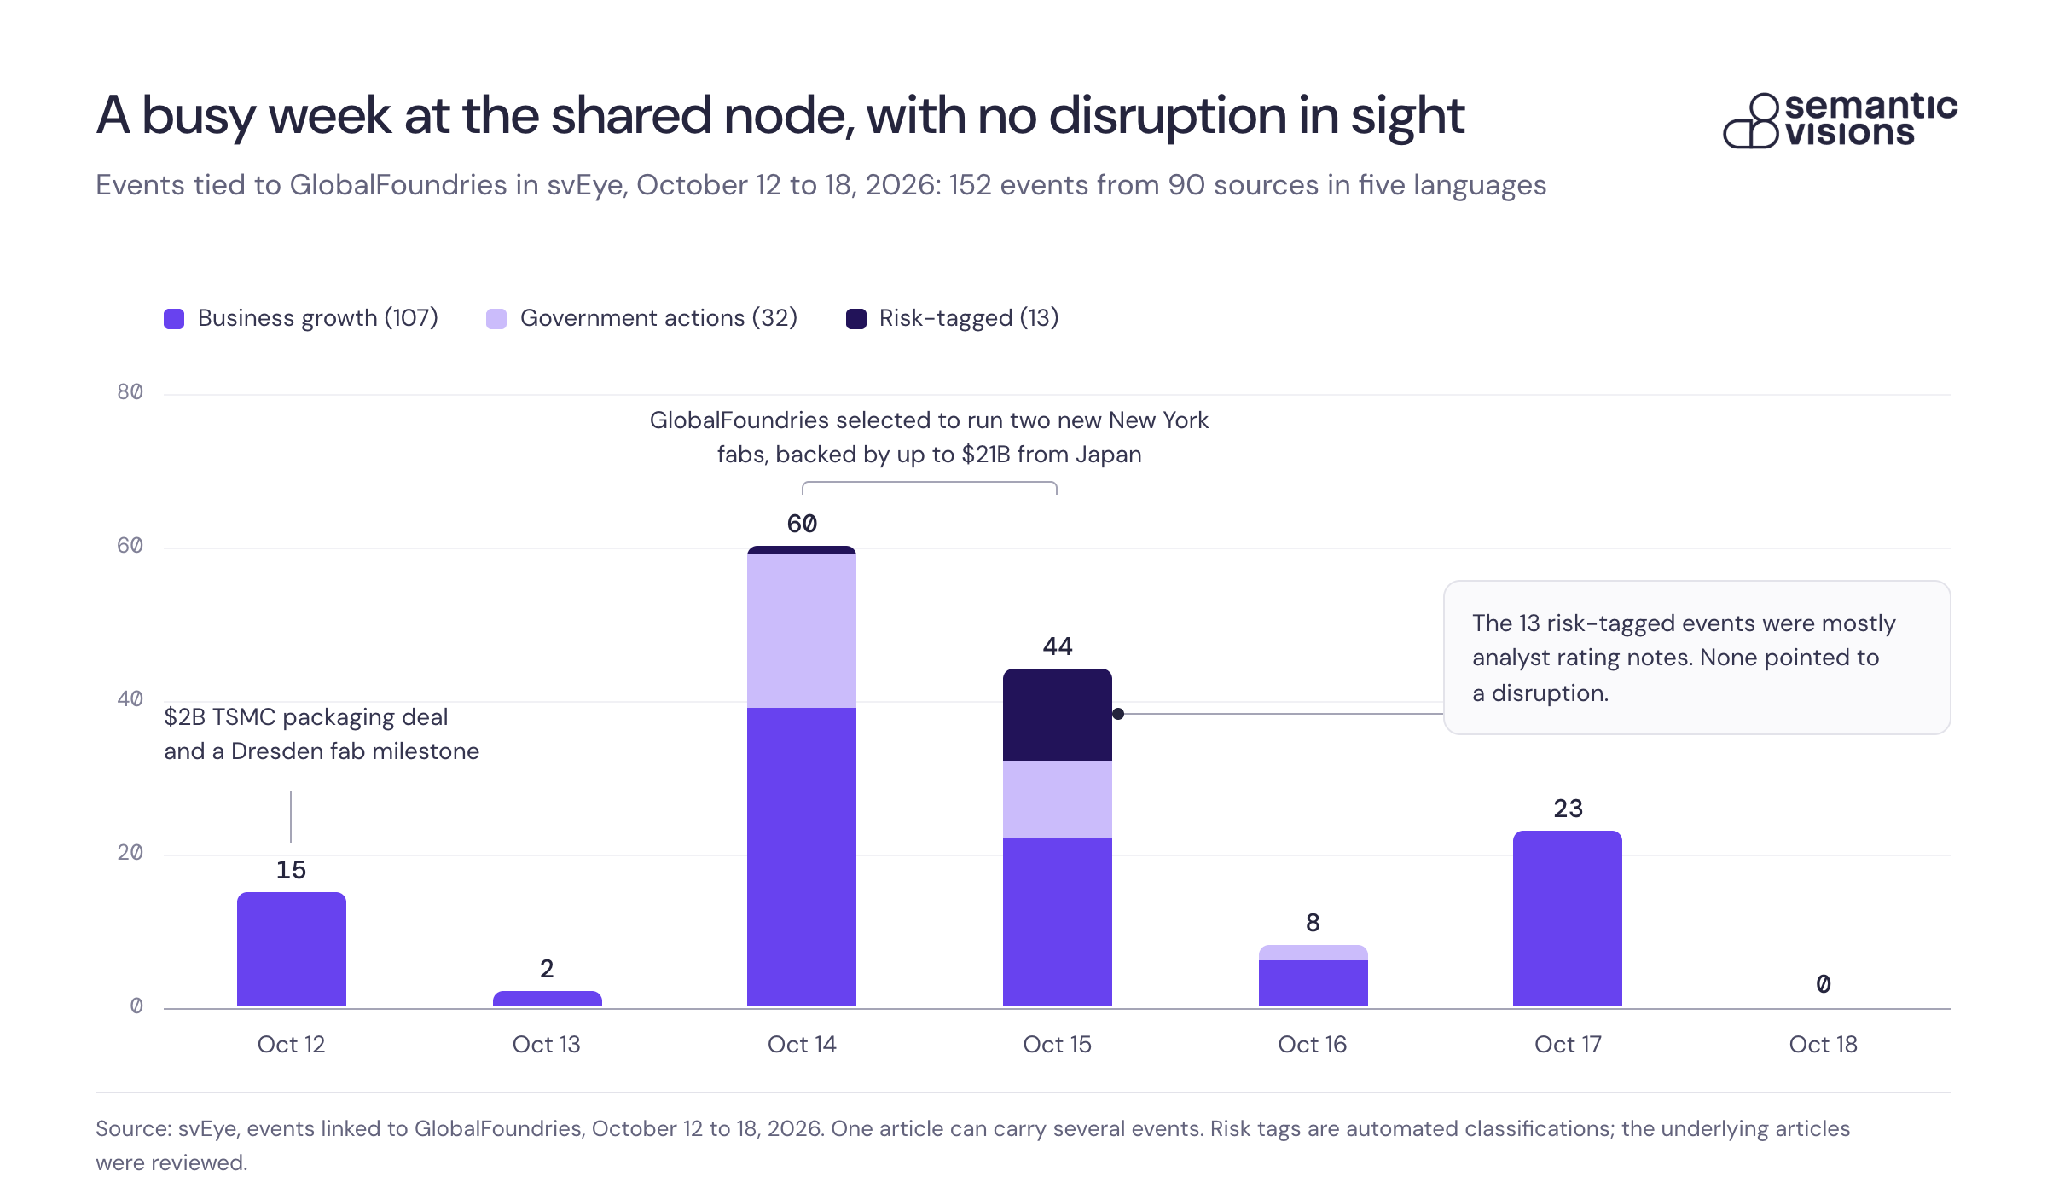
What does watching a shared node look like in practice? The chart below shows one week of events svEye linked to GlobalFoundries, the shared company in the example above. A lot happened, from a $2B packaging deal with TSMC to up to $21B in Japan-backed fabs in New York, and about a third of the coverage was in Chinese, Japanese, Russian and Italian. None of it pointed to a disruption. The 13 events tagged as risks turned out to be mostly analyst rating notes once someone read the underlying articles, which is exactly why signal quality matters more than counts.
Why signal quality beats keyword counts
Counting keyword mentions of a supplier name produces a noisy number. It cannot tell a product launch from a fire, cannot separate two companies with similar names, and often misses reporting in a supplier's local language. Evidence-first intelligence works differently. svEye reads roughly 1.9 million articles a day across 12 languages from about 900,000 sources and converts them into structured, source-linked events, drawing on 700+ event types, with hourly updates. Each event is tied to a resolved entity and carries the true timestamp of when it occurred, not only when it was reported.
That distinction has practical consequences. A fire reported in a regional-language outlet three days before an English-language wire picks it up is three days of lead time, but only if you can see the event, attribute it to the right entity, and know when it really happened. Our white paper on native-language OSINT documents case studies with up to nine days of lead time on supply chain disruptions before global markets reacted.
A simple scoring concept
You do not need an elaborate model to start. Three moves are enough:
- Normalize each indicator category to a common scale (for example, events per rolling 30 days relative to that entity's own baseline).
- Weight by criticality: how much of your output or revenue depends on that supplier, material, or node, and how long substitution would take.
- Track trend and acceleration, not just level. A dependency with a moderate score that doubled in two weeks deserves more attention than a high but stable one.
Acceleration is the piece most teams skip, and it is frequently the earliest warning. Early-warning intelligence also has to avoid flooding analysts with alerts. Our article on early-warning risk intelligence covers how to keep volume manageable.
From alerts to defensible decisions
A signal that cannot be defended internally rarely changes a decision. Risk and compliance leaders usually need to answer three questions when they escalate: what happened, when did it happen, and why does it affect us? A defensible output has a source link for every event, a timestamp that reflects when the event occurred, and a clear path from the upstream entity to the downstream relationships it touches.
Workflow design should serve three audiences. Analysts need real-time alerts and drill-down into sources. Leadership needs dashboards that show concentration drivers and trend direction without raw event feeds. Governance forums need exportable outputs that document what was seen, when, and what was decided.
Here is an illustrative workflow, not a customer case:
- Identify a concentration driver. Mapping shows that four of your Tier 1 suppliers for a critical assembly share one Tier 2 casting supplier in a single region.
- Confirm corroborating events. Monitoring picks up a local-language report of a labor dispute at that supplier. A second source reports reduced shipments from its main port.
- Escalate against defined thresholds. Two independent sources within the rolling window meet your corroboration rule, and the dependency is flagged as critical, so it moves from watchlist to escalation.
- Document the evidence trail. The event links, timestamps, and the affected relationships are exported to the risk committee, along with the decision taken: pre-build inventory, qualify an alternate, or open a conversation with the Tier 1 suppliers.
Semantic Visions states that this kind of upstream monitoring can detect Tier 2 and Tier 3 risk 22 or more days before it reaches the production line. As with any lead-time claim, actual results depend on the network, the category, and the quality of the mapping, so test it against your own history. With up to 10 years of event history available, you can back-test: pick a past disruption and check how early the upstream signals appeared. That exercise is often the quickest way to build an internal business case.
Third-party risk teams will recognize the same logic. Questionnaires capture what a supplier says on an annual cycle, while the world publishes what is happening to it continuously. Our piece on OSINT-based third-party risk monitoring explores that gap in more detail.
An implementation checklist you can start this quarter
You can make progress in one quarter without a transformation program. Work through these in order:
- Baseline your coverage. Document which categories and tiers you can see today and which dependency types (materials, geographies, logistics, compliance) you cannot. State the gap explicitly, for example "Tier 2 for our top 20 critical components."
- Stand up a mapping step. Combine procurement and BOM data with open-source relationship discovery. Start with the categories where a stoppage would hurt most.
- Define indicators and thresholds. Pick indicators from the four categories above, set initial thresholds, and write the corroboration rule down.
- Assign owners and cadence. Decide who receives alerts, who updates the map, and who approves changes. Set a review rhythm, monthly at minimum for critical categories.
- Pick your KPIs. Three work well: time-to-detection for upstream shocks, percentage of critical suppliers with mapped sub-tier dependencies, and the number of "surprise" events, meaning disruptions that reached you without a prior upstream signal.
Begin with a narrow scope and expand once the workflow holds. A well-run map of 20 critical components is more useful than a shallow one covering everything.
Concentration risk is a detection design problem
Teams often respond to supply chain opacity by collecting more data. More data does not locate shared dependencies. A mapped relationship graph, dependency logic that explains why things concentrate, indicators that move early, and governance that keeps all of it current will do that. Volume helps only when it is entity-resolved, time-aware, and tied to the relationships you care about.
A useful self-check: where are you currently assuming that Tier 1 outcomes predict Tier 2 reality? If a Tier 1 supplier reports no problems, what evidence do you have about the three companies it depends on? If the honest answer is "none," that is the first gap to close.
If you would like to see how multi-tier mapping and event-based monitoring change coverage and detection time for your own categories, Semantic Visions can walk through a sample on your critical suppliers. You can start with the multi-tier supply chain mapping overview and bring a past disruption to test against.
Access Premium Insights



See Everything. Focus on What Matters.
svEye™ filters the noise to uncover meaningful patterns and insights. Gain clarity, stay informed, and drive smarter decisions with a comprehensive overview.

