
Extended Sentiment Data for Global Equity Portfolios
How machine learning applied to company-level sentiment from millions of global news articles revealed predictive signals across three distinct equity universes.
Download the white paper to explore how global news flow can be transformed into structured investment signals — and what happened when those signals were tested from the Nasdaq 100 to small- and mid-cap stocks.
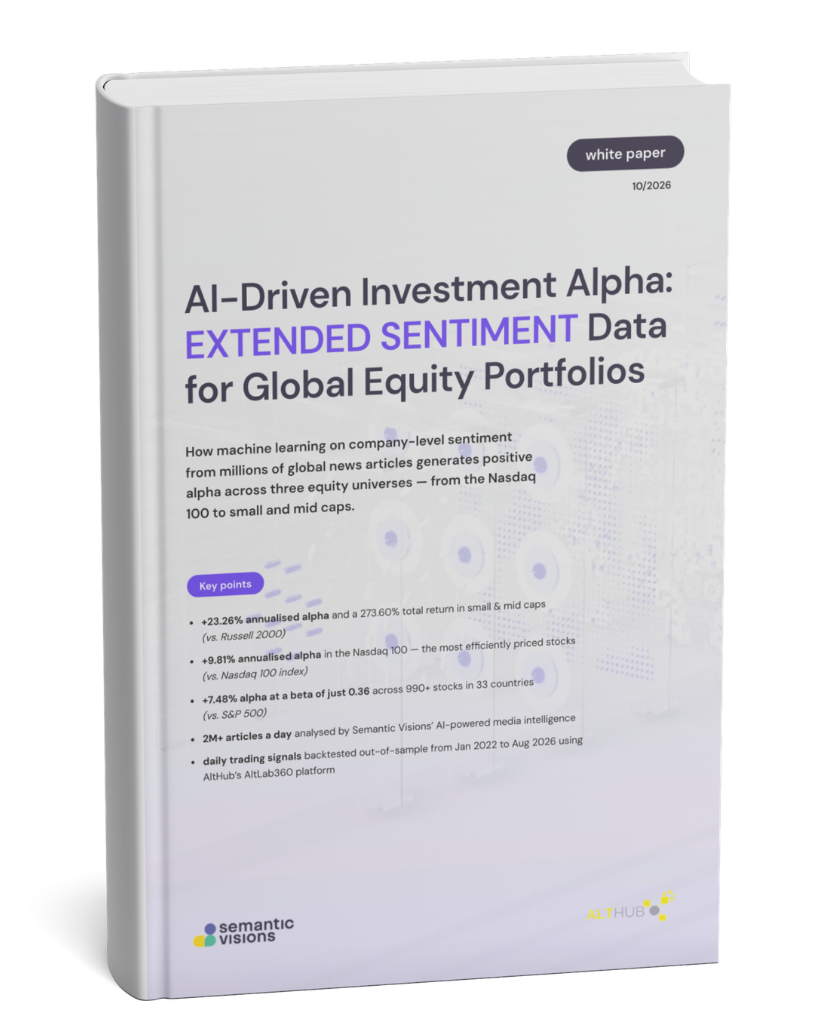
Access the full study, methodology and portfolio results.
About this White Paper
Markets do not wait for quarterly reports. Changes in media attention and tone can emerge well before their potential impact appears in company fundamentals, earnings guidance or analyst commentary.
Semantic Visions Extended Sentiment Data transforms global news coverage into structured, company-level signals. By measuring both how much the media is discussing a company and how the tone of that coverage is changing, the dataset creates a continuous view of evolving market narratives.
For this study, AltHub used the data to develop machine-learning price-prediction models across three distinct equity universes. The models were trained on data from 2015 to 2021 and evaluated out of sample from January 2022 to August 2026 — a period spanning market drawdowns, recoveries and renewed volatility.
The results show how sentiment extracted from open-source media can provide a differentiated and scalable input for systematic equity strategies.
You’ll learn how to
- Transform article-level news sentiment into structured, ticker-level daily investment signals
- Capture changes in media attention, sentiment direction and narrative momentum
- Integrate Extended Sentiment Data into factor models, risk systems and machine-learning pipelines
- Compare signal performance across large-cap, broad global and small- to mid-cap equity universes
- Evaluate results using out-of-sample testing, point-in-time universes and look-ahead protections
- Assess how transaction costs and portfolio turnover affect headline returns
- Understand where media-derived signals may offer the greatest information advantage
Who should read this
- Hedge fund managers and systematic investment teams
- Quantitative researchers, analysts and data scientists
- Portfolio managers and investment strategists
- Alternative data and data-sourcing teams
- Equity long-short and market-neutral investors
- Investment risk and portfolio-construction professionals
- Financial institutions exploring AI-driven investment intelligence
What’s inside
- From global news to investment signals: How Semantic Visions structures company-level media attention and sentiment
- Data transformation: How raw article data becomes a consistent daily security-level time series
- Feature engineering: Moving averages, rolling sums and changes in media attention across multiple time horizons
- Machine-learning models: How different model families and prediction horizons were evaluated
- Portfolio construction: Long-short selection, factor weighting and daily rebalancing rules
- Out-of-sample performance: Results across three distinct equity universes
- Risk and attribution analysis: Beta, volatility, drawdown, Sharpe and Sortino ratios
- Transaction-cost sensitivity: What remained when assumed trading costs of 1–5 basis points were applied
What the Study Found
Positive alpha across all three universes tested
The sentiment-based models produced positive alpha across highly liquid US technology stocks, a broad multi-country equity universe and a dedicated small- and mid-cap portfolio.
Nasdaq 100
9.81% annualised alpha
The Nasdaq 100 portfolio delivered a 136.93% total return and a 20.80% CAGR during the out-of-sample testing period, demonstrating that the sentiment signal added information even within one of the market’s most heavily researched equity universes.
Broad Equity Universe
7.48% annualised alpha at a beta of 0.36
The broad portfolio covered 990 stocks across 33 countries. It delivered a 66.60% total return, annualised volatility of 9.70% and a maximum drawdown of −12.50%. Approximately half of its net return came from securities outside the United States.
Small and Mid Caps
23.26% annualised alpha
The Small Cap–Mid Cap Top 500 portfolio delivered a 273.60% total return and a 33.30% CAGR against the Russell 2000 benchmark. Approximately three in four of the 502 securities contributed positively to performance.
Supporting line below the results:
The strongest results appeared where analyst and media coverage was thinner — suggesting that changes in global news attention and tone may offer greater information value where fewer market participants are watching.
Built to Test the Signal
A compelling backtest should do more than produce an attractive headline return. It should make the testing conditions transparent.
The study therefore includes:
- A separate 2015–2021 model-training period
- An out-of-sample testing period from January 2022 to August 2026
- Point-in-time construction of the Nasdaq 100 universe
- A 30–60-minute lag applied to article timestamps
- Market-capitalisation and liquidity eligibility rules
- Daily portfolio rebalancing and explicit portfolio-construction rules
- Transaction-cost sensitivity from 1 to 5 basis points per trade
Even at an assumed cost of 5 basis points per transaction, the three portfolios retained approximately 66–80% of their cost-free returns, although the study also identifies high turnover as an important implementation consideration.
Explore Real-Time Risk Detection in svEye™
See how dynamic event monitoring works in practice. Track supplier and partner risks across jurisdictions, industries, and ownership networks — all in one dashboard.
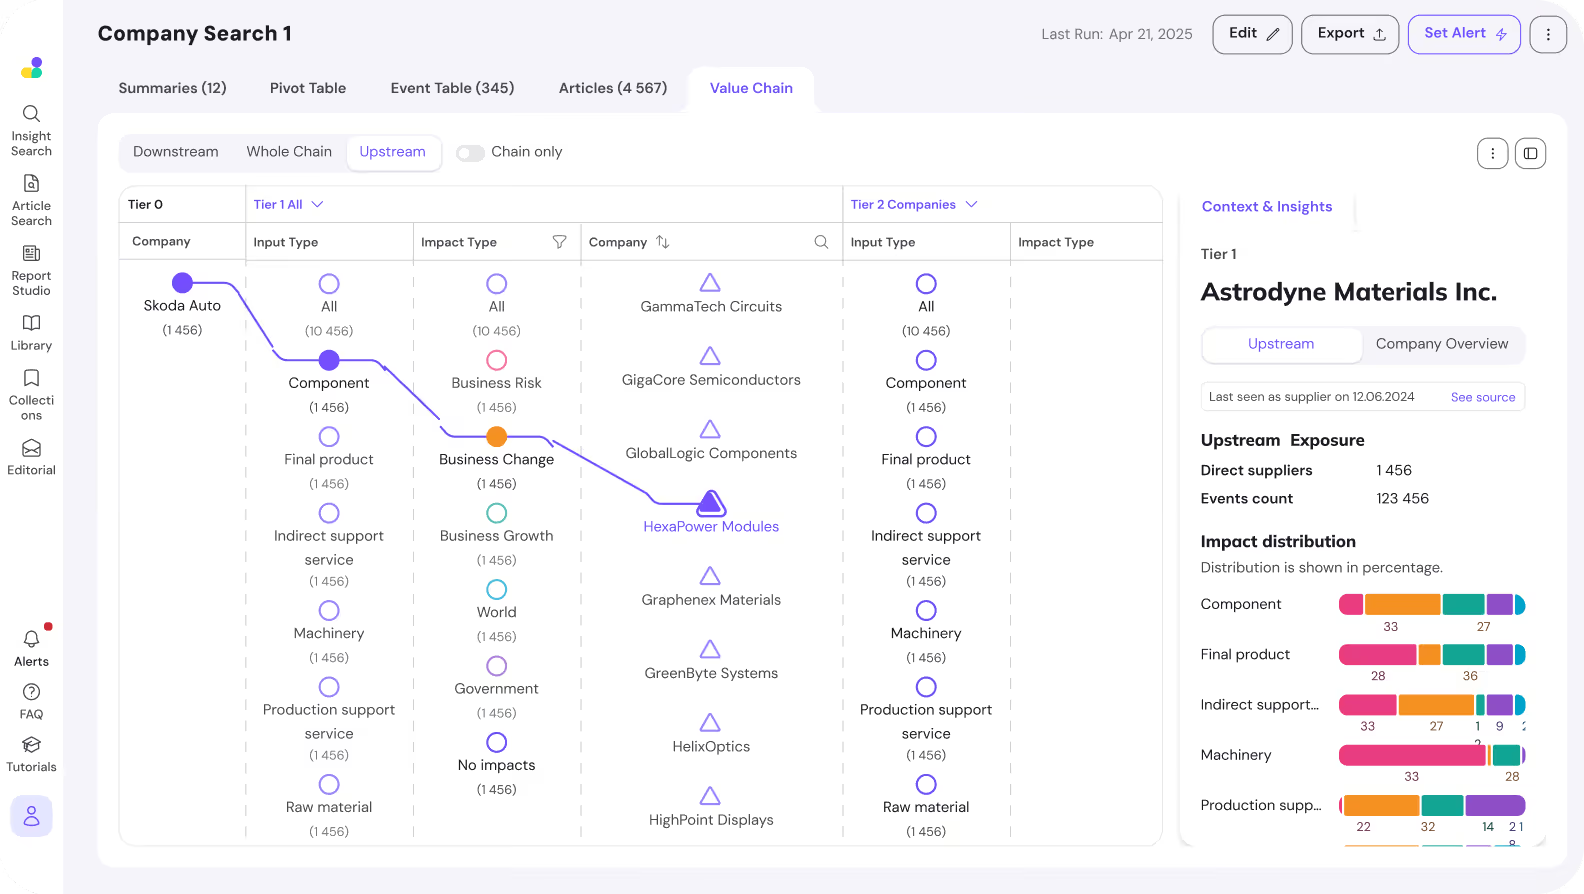
Map Your Competiton
or Monitor Your Supply Chain
Contact us to get a customized competitive analysis tailored to your industry and specific business needs or discover other tiers of your supply chain. Let us help you stay ahead in the market.
