How to Use Multi-Tier Supply Chain Mapping in svEye

Share this post
Get a personalized tour of Semantic Visions

Talk to our experts and discover how real-time data insights can support your business.

Book a Demo

The Multi-Tier Supply Chain Mapping feature lets you visualize and explore the extended supplier networks of selected companies or brands. Follow these steps to unlock a complete view of upstream dependencies and risks:

svEye search interface showing New Search parameters panel with date range from Sep 11, 2025 to Sep 11, 2025, entities section with multi-tier supply chain mapping checkbox available, and company search field displaying dropdown with companies like AT&T Inc, Abbvie Farmaceutica SL, Accenture Company Ltd, and others. Multi-tier icon visible next to eligible companies.

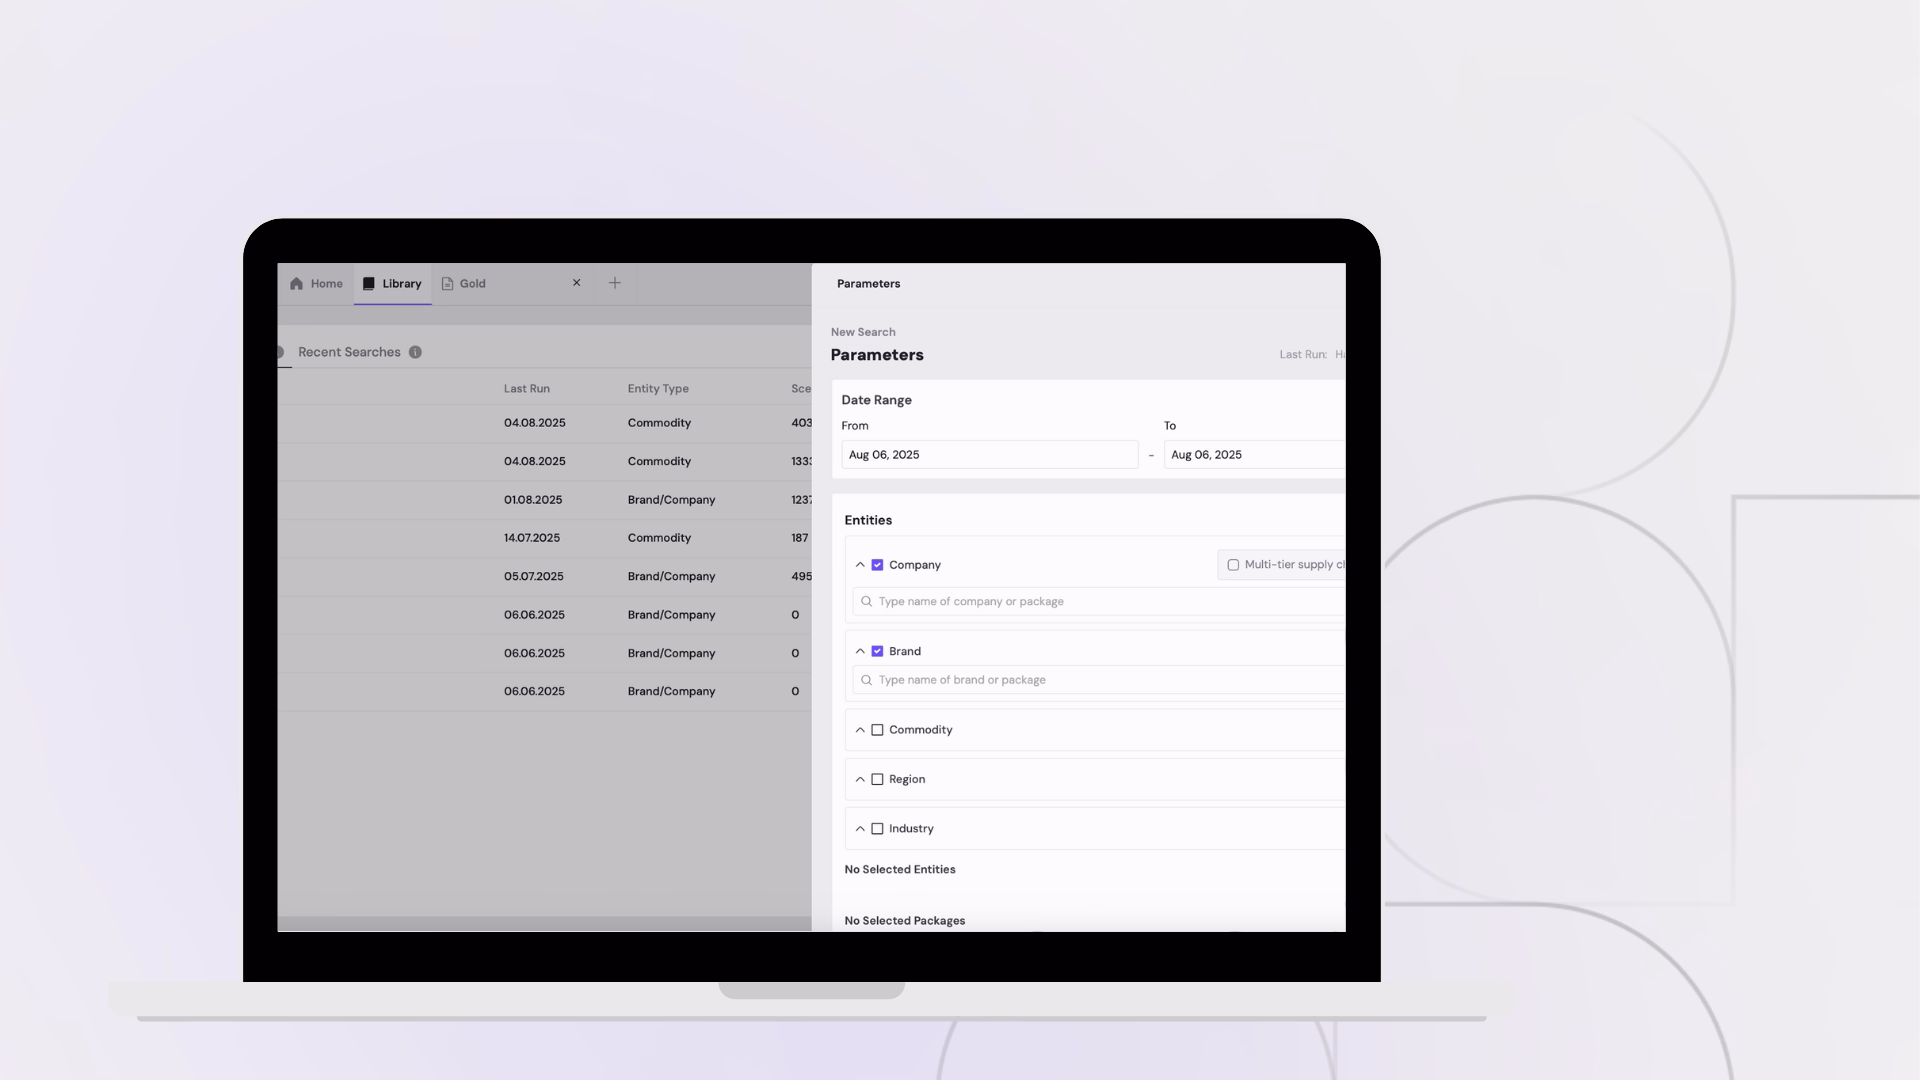
Step 1: Start a New Search

  • Go to New Search in the main navigation.
  • In the Entities section, type the name of a company or brand.
  • Look for the small multi-tier icon next to companies that have supply chain mapping available.
Multi-tier Supply Chain tab in svEye Detailed View showing supply chain network visualization with color-coded nodes representing companies like Cdr Life Inc (green), Cenit (orange), Hellstar (red), and Fss Inter SAS (gray). Filter dropdown for Events is open displaying options: Business Change, Business Growth, Business Risk, Governments, and World. Network shows connections between supplier tiers.

Step 2: Enable Multi-Tier Supply Chain Mapping

  • Select the company you want to analyze.
  • Tick the checkbox Multi-tier supply chain mapping to include supplier networks in your results.
  • Adjust the date range to define the period of events you want to track.
  • Click Run to generate results.
svEye New Search parameters panel with Multi-tier supply chain mapping checkbox checked and highlighted in blue tooltip. Interface shows date range Sep 06, 2024 to Sep 11, 2025, and entity selection sections for Company, Brand, Commodity, Region, and Industry. Selected entity "Airbus SE" appears in the Selected Entities section at bottom.
svEye search results dashboard showing Impact analysis with circular chart, Events section with purple rectangles for New Sales Contracts (80), Equity Opportunity (52), and Mergers and Acquisitions (50), Timeline graph, and TOP 5 Categories pie chart. Detailed View tabs shown at bottom with Multi-tier Supply Chain tab highlighted.

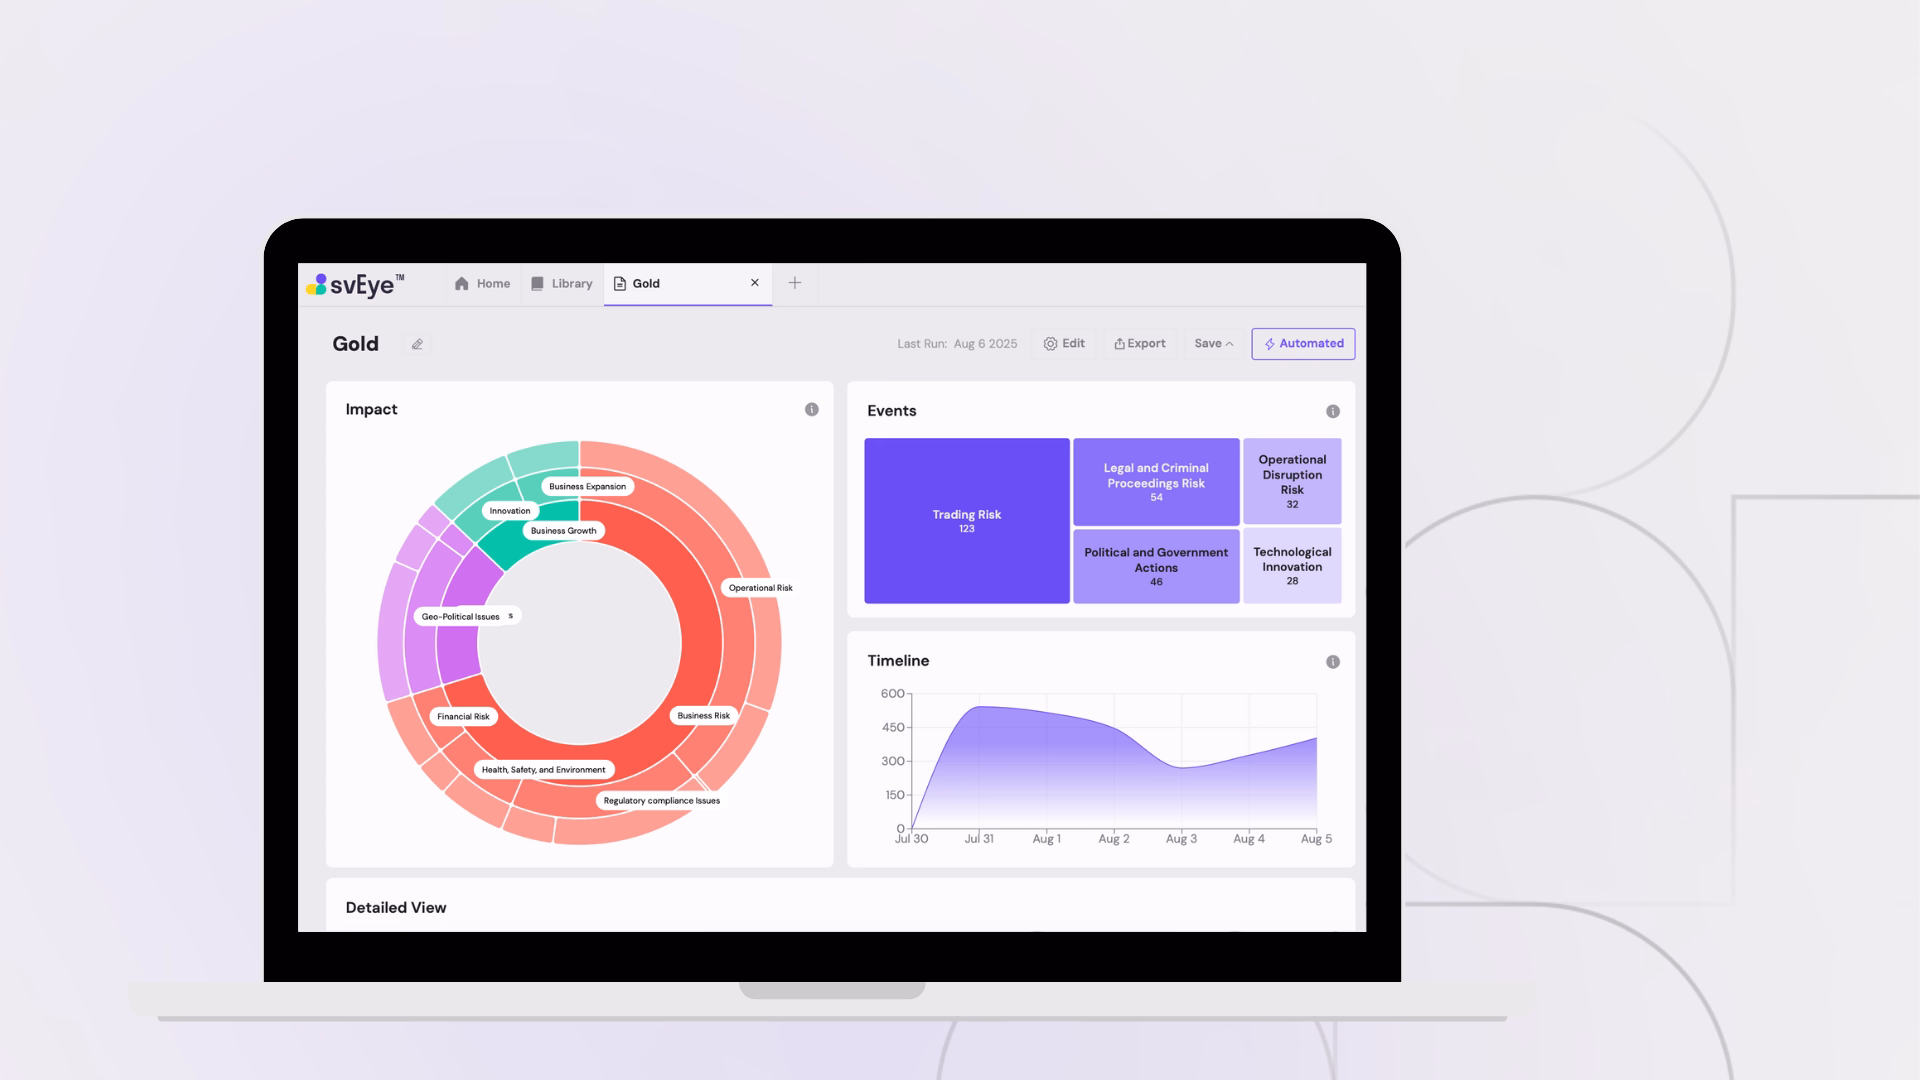
Step 3: Open the Multi-Tier Tab in Results

  • In the results dashboard, go to Detailed View.
  • Select the tab Multi-tier Supply Chain.
  • You’ll see a preview map in the lower left corner to help you navigate complex networks.
svEye search results dashboard showing Impact analysis with circular chart, Events section with purple rectangles for New Sales Contracts (80), Equity Opportunity (52), and Mergers and Acquisitions (50), Timeline graph, and TOP 5 Categories pie chart. Detailed View tabs shown at bottom with Multi-tier Supply Chain tab highlighted.

Step 4: Explore the Supply Chain Network

  • Companies are displayed as nodes arranged by tier level (direct suppliers, sub-suppliers, etc.).
  • Connections between nodes are shown with different line types:
    • Component
    • Subassembly
    • Raw material
    • Machinery
    • Production support service
    • Indirect support service
    • Final product
Multi-tier Supply Chain tab interface showing filtering options for Supplier type, Events, and Tier level with dropdown menus. Supply chain visualization displays vertical arrangement of color-coded company nodes: orange nodes at top and bottom, green nodes in middle section, and gray node, representing different supplier tiers and event categories.

Step 5: Interpret Node Colors and Events

  • Each node is color-coded to highlight events linked to the company during the selected time frame:
    • Red → Business risks
    • Green → Business opportunities or growth
    • Orange/Gray → Other event categories
  • Nodes with an expand icon can be clicked to reveal additional suppliers.
Complete multi-tier supply chain network visualization for Airbus showing interconnected companies across different tiers. Green nodes (Cfm International, Cdr Life Inc, Cfm International Inc), orange nodes (Composites Technology Research Malaysia, Cenit, sites Research Sn. Bhd., Cenit AG), red nodes (Hellstar, Hellstar SAS), and gray nodes (Fss Inter, Fss Inter SAS) connected by various line types. Connectors legend visible in bottom right corner.

Step 6: Use Filters to Refine the Map

  • Supplier type – focus on raw materials, components, machinery, etc.
  • Tier level – view direct suppliers only or expand to sub-suppliers.
  • Events – highlight suppliers connected to specific risks or opportunities (e.g., Business Change, Business Risk, Governments).
  • Search bar – find a specific company within the network instantly.
Multi-tier supply chain mapping interface with Supplier type dropdown menu open, showing filtering options: Component, Final product, Indirect support service, Machinery, Production support service, Raw material, and Subassembly. Background shows the same network visualization with color-coded supplier nodes and connection lines.

Related tutorials

Setting Up and Running Searches

Working with Search Results and Filters

Navigating the Map Interface

See Everything. 
Focus on What Matters.

svEye™ filters the noise to uncover meaningful patterns and insights. Gain clarity, stay informed, and drive smarter decisions with a comprehensive overview.